
Corporate governance and social responsibility
International Journal of Law and Management
Corporate governance and social responsibility
Marty Stuebs Li Sun
Article information:
Downloaded by Universitas Muhammadiyah Malang At 20:22 27 March 2015 (PT)
To cite this document:
Marty Stuebs Li Sun , (2015),"Corporate governance and social responsibility", International Journal
of Law and Management, Vol. 57 Iss 1 pp. 38 - 52
Permanent link to this document:
http://dx.doi.org/10.1108/IJLMA-04-2014-0034
Downloaded on: 27 March 2015, At: 20:22 (PT)
References: this document contains references to 36 other documents.
To copy this document: permissions@emeraldinsight.com
The fulltext of this document has been downloaded 379 times since 2015*
Users who downloaded this article also downloaded:
Luu Trong Tuan, (2012),"Corporate social responsibility, ethics, and corporate governance", Social
Responsibility Journal, Vol. 8 Iss 4 pp. 547-560 http://dx.doi.org/10.1108/17471111211272110
Lance Moir, (2001),"What do we mean by corporate social responsibility?", Corporate Governance:
The international journal of business in society, Vol. 1 Iss 2 pp. 16-22 http://dx.doi.org/10.1108/
EUM0000000005486
Yingjun Lu, Indra Abeysekera, Corinne Cortese, (2015),"Corporate social responsibility reporting
quality, board characteristics and corporate social reputation: Evidence from China", Pacific
Accounting Review, Vol. 27 Iss 1 pp. 95-118 http://dx.doi.org/10.1108/PAR-10-2012-0053
Access to this document was granted through an Emerald subscription provided by 609392 []
For Authors
If you would like to write for this, or any other Emerald publication, then please use our Emerald
for Authors service information about how to choose which publication to write for and submission
guidelines are available for all. Please visit www.emeraldinsight.com/authors for more information.
About Emerald www.emeraldinsight.com
Emerald is a global publisher linking research and practice to the benefit of society. The company
manages a portfolio of more than 290 journals and over 2,350 books and book series volumes, as
well as providing an extensive range of online products and additional customer resources and
services.
Emerald is both COUNTER 4 and TRANSFER compliant. The organization is a partner of the
Committee on Publication Ethics (COPE) and also works with Portico and the LOCKSS initiative for
digital archive preservation.
*Related content and download information correct at time of
download.
The current issue and full text archive of this journal is available on Emerald Insight at:
www.emeraldinsight.com/1754-243X.htm
IJLMA
57,1
Corporate governance and social
responsibility
38
Department of Accounting and Business Law,
Hankamer School of Business, Baylor University, Waco, Texas, USA, and
Marty Stuebs
Li Sun
Downloaded by Universitas Muhammadiyah Malang At 20:22 27 March 2015 (PT)
Department of Accounting and MIS, Collins College of Business,
University of Tulsa, Tulsa, Oklahoma, USA
Abstract
Purpose – This paper aims to draw on the stakeholder theory to examine the association between
corporate governance and social responsibility.
Design/methodology/approach – This paper hypothesized that corporate governance is positively
associated with corporate social responsibility (CSR), and good corporate governance also leads to good
social responsibility in the following year. Corporate governance was measured by using the corporate
governance index provided by Brown and Caylor (2006, 2009). CSR data come from Kinder, Lydenberg
and Domini (KLD), Inc.
Findings – Regression analysis documents significant evidence to support a positive association
between corporate governance and social responsibility. Evidence suggests that good governance leads
to good CSR performance.
Originality/value – The results should interest managers who engage in behavior leading to or
maintaining strong corporate governance mechanisms, financial analysts who conduct research on
corporate governance and firm performance and policymakers who design and implement guidelines
on corporate governance mechanisms. Moreover, results of this study can increase individual investors’
confidence in investing in companies with stronger corporate governance.
Keywords Corporate social responsibility, Corporate governance, Stakeholder theory
Paper type Research paper
International Journal of Law and
Management
Vol. 57 No. 1, 2015
pp. 38-52
© Emerald Group Publishing Limited
1754-243X
DOI 10.1108/IJLMA-04-2014-0034
1. Introduction
Stakeholder theory (Hill and Jones, 1992) focuses on the importance of a firm’s
relationship with stakeholders. Relationships with various stakeholder groups like
customers, employees and the community affect firm performance whether or not those
stakeholder groups share in ownership rights. Effectively responding to and managing
these stakeholder relationships is critical to success. Successful relationships are based
on trust, and trust is created and maintained by meeting and exceeding responsibilities
to stakeholders. Corporate governance mechanisms play an important role in this
process. They build and maintain trust by ensuring that responsibilities are either met
or exceeded. For example, Sarbanes–Oxley reforms are efforts to repair public trust by
improving governance mechanisms assuring financial reporting responsibilities to
various stakeholders. Does improved governance further improve trust by assuring that
other stakeholder and social responsibilities besides financial reporting responsibilities
are met? Does governance improve other dimensions of performance besides financial
performance?
Downloaded by Universitas Muhammadiyah Malang At 20:22 27 March 2015 (PT)
In this study, we examine the relationship between corporate governance and social
responsibility. We posit that:
• corporate governance is positively associated with social responsibility; and
• good corporate governance leads to good future social responsibility.
We measure corporate governance by using the corporate governance index provided
by Brown and Caylor (2006, 2009). Corporate social responsibility (CSR) data come from
Kinder, Lydenberg, and Domini (KLD), Inc. Our study documents significant evidence
to support a positive association between corporate governance and social
responsibility. In addition, the results suggest good corporate governance leads to good
social responsibility in the following year.
Our paper delivers new evidence on the link between corporate governance and
social responsibility. It integrates and contributes to the corporate governance literature
and emerging accounting literature on CSR. The results should interest managers who
engage in behavior leading to or maintaining strong corporate governance mechanisms,
financial analysts who conduct research on corporate governance and firm performance
and policymakers who design and implement guidelines on corporate governance
mechanisms. Moreover, results in this study can increase individual investors’
confidence in investing in companies with stronger corporate governance.
The remainder of the paper is organized as follows. Section 2 reviews prior research
and develops the hypotheses. Section 3 describes our research design, including
measurement of primary variables and empirical specification. Section 4 describes
sample selection and descriptive statistics, while Section 5 reports the results from our
regression analyses. Section 6 reports supplemental tests, and Section 7 summarizes the
study.
2. Literature review and hypothesis development
2.1 Review on CSR
CSR is defined as “the voluntary integration of social and environmental concerns into
business operations and into their interaction with stakeholders” (European
Commission, 2002). Vilanova et al. (2009) propose that the definition of CSR consists of
five dimensions, including vision, community relations, workplace, accountability and
marketplace. Vision, for example, includes CSR conceptual development, codes and
value within the organization. Community relations include partnerships with different
stakeholders such as customers, suppliers, etc. Workplace includes human rights and
labor practices within the organization. Accountability includes the transparency in
communication and financial reporting. Marketplace includes the relationship between
CSR and core business processes such as sales, purchasing, etc.
Many prior studies (Cochran and Wood, 1984; McGuire et al., 1988; Waddock and
Graves, 1997; Griffin and Mahon, 1997; Roman et al., 1999; Tsoutsoura, 2004; Beurden
and Gosslin, 2008) suggest a positive relation between CSR and financial performance.
The consensus appears to be that a positive relation exists between CSR and financial
performance. Some CSR studies examine the relation between CSR and other firm
characteristics. Dhaliwal et al. (2011) find firms with superior CSR performance also
receive favorable analyst coverage and achieve lower absolute forecast errors and
dispersion. Dhaliwal et al. (2012) examine the relation between CSR disclosure and
analyst forecast accuracy using firm-level data from 31 countries, and find that the
Corporate
governance
and social
responsibility
39
Downloaded by Universitas Muhammadiyah Malang At 20:22 27 March 2015 (PT)
IJLMA
57,1
issuance of CSR reports is associated with lower analyst forecast error. Kim et al. (2012)
document a positive relation between CSR and earnings quality, suggesting that
socially responsible firms have higher earnings quality. In summary, the above CSR
studies suggest that engaging in CSR activities may bring future benefits to firms.
40
2.2 Review on governance
Corporate governance is important to a firm’s performance and success. Much of the
research in this area documents how corporate governance mechanisms affect
dimensions of financial reporting and performance. Abdel-Khalik (2002) proposed
post-Enron governance reforms to, among other things, improve auditor selection,
retention and compensation. Recent work also documents financial reporting benefits
from corporate governance. For example, there is less information asymmetry around
quarterly earnings announcements (Kanagaretnam et al., 2007), and the quality of
information available to financial analysts increases with higher levels of corporate
governance (Byard et al., 2006). Given these reporting benefits, the determinants of good
reporting governance have been investigated and documented. Board of Directors and
audit committee characteristics like independence (Jaggi et al., 2009; Bronson et al., 2009)
and expertise (DeZoort et al., 2003, Gul and Leung, 2004; Kelton et al., 2008) ensure good
governance and high-quality financial reporting. Do corporate governance mechanisms
have similar positive effects on other dimensions of firm performance besides financial
reporting?
Stakeholder theory (Hill and Jones, 1992) focuses on the importance of stakeholder
relationships and recognizes stakeholders’ impact on firm sustainability and success. A
stakeholder can be thought of as a “group or individual who can affect or is affected by
the achievement of the organization’s objectives” (Freeman, 1984, p. 46). Because
stakeholder relationships affect organization objectives, they are important. Effective
stakeholder relationships are based on trust. Trust in these relationships is built and
maintained by continually meeting and exceeding responsibilities. Effective corporate
governance plays an important role in facilitating effective stakeholder relationships.
Corporate governance builds and maintains stakeholder trust by assuring that firm
responsibilities are met and exceeded.
Empirical research on corporate governance suggests a positive link between
corporate governance and different dimensions of firm performance. Good governance
protects shareholder interests and reduces principal–agent problems (Riyanto and
Toolsema, 2007). Specifically, Brown and Caylor (2009) argue that good corporate
governance creates a system of greater control over managerial actions, which, in turn,
should reduce principal–agent problems and improve trust. As a result, Brown and
Caylor (2009) find that governance improves operating performance measured by return
on assets (ROA) and return on equity (ROE). They rely on data from Institutional
Shareholder Service (ISS) to create a firm-specific corporate governance measure known
as Gov-Score. Unlike other governance indexes, Gov-Score is based on both internal and
external factors.
Corporate governance may be related to other dimensions of performance like
dimensions of corporate social performance in addition to operating performance. While
the relationship between corporate governance and operating performance has received
attention, governance’s relationship with CSR has largely gone unexplored. Recent
work has begun to explore the relationship between corporate governance and specific
dimensions of CSR like environmental performance. Stuebs and Sun (2010) find that
governance is positively associated with a firm’s environmental strengths. Earnhart
(2002) finds that concentrated ownership improves environmental performance. The
idea is that concentrated ownership creates strong governance which facilitates better
cost management, including environmental cost management. We extend this work by
investigating the following question: What is the relationship between corporate
governance and CSR? This question leads to the two following hypotheses in this paper:
H1. Corporate governance is positively associated with social responsibility
performance.
Downloaded by Universitas Muhammadiyah Malang At 20:22 27 March 2015 (PT)
H2. Good corporate governance leads to good social responsibility performance.
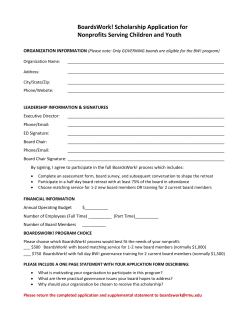
3. Research design and variable description
Brown and Caylor’s (2006, 2009) Gov-Score measure and KLD’s CSR data are used to
investigate the relationship between corporate governance and CSR. Figure 1 We also
include five control variables to control for firm size, age of long-term assets, leverage,
return on assets and the market-to-book ratio. The next two sections provide details on
how we measure the primary variables of interest in this study, i.e. CSR and corporate
governance.
3.1 Measurement of the primary dependent variable – CSR
KLD, a Boston-based consulting firm, has been actively providing rating data on CSR
since 1991. KLD data are an influential measure of CSR. While many investment
managers rely on KLD data when making social screening, the KLD data are also
frequently used in academic literature. It is “the largest multidimensional corporate
social performance database available to the public and is used extensively in research
on corporate social performance” (Deckop et al., 2006, p. 334). KLD accumulates CSR
information for more firms than other CSR data sources. It has become “the de facto
corporate social performance research standard at the moment” (Waddock, 2003, p. 369).
KLD provides rating data for approximately 80 variables in 7 qualitative areas for
each selected firm. The seven areas include community, corporate governance,
diversity, employee relations, environment, human rights and product. For each
qualitative variable, positive ratings indicate strengths, and negative ratings indicate
concerns. For example, the environment area contains six strength items (beneficial
products, pollution prevention, recycling, clean energy, property plant and equipment
and other strengths) and six concern items (hazardous waste, regulatory problems,
ozone depleting chemicals, substantial emissions, agriculture chemicals and other
concerns). In addition to these seven qualitative areas, KLD also evaluates six
controversial issues that include, alcohol, gambling, firearms, military, nuclear power
and tobacco activities. Involvement in any of these six controversial issues results in a
negative rating. A complete listing strengths and concerns for KLD variables is
provided in the Table AI.
Consistent with prior research (Chen et al., 2008; Cho et al., 2006; Deckop et al., 2006;
Nelling and Webb, 2009; Ruf et al., 2001; Johnson and Greening, 1999; Griffin and
Mahon, 1997; Shropshire and Hillman, 2007; Waddock and Graves, 1997; Graves and
Waddock, 1994), we subtract total concerns from total strengths and assign equal
Corporate
governance
and social
responsibility
41
IJLMA
57,1
Theoretical Model
Corporate
Governance
42
Corporate
Social Responsibility
(+)
Operational Model
Downloaded by Universitas Muhammadiyah Malang At 20:22 27 March 2015 (PT)
H1 (+)
(Table 4 Panel A)
Brown and Caylor’s
(2006, 2009)
Gov-Score
Measure
KLD Index Score
H2 (+)
(Table 4 Panel B)
Control Variables:
Size (Sales)
Age of Assets
Leverage
Figure 1.
Provides an overview
of the research
design we use to test
our hypotheses
Return on Assets (ROA)
Market-to-Book Ratio
importance/weight to each area in calculating the KLD index score. This approach is
also suggested by KLD[1].
The KLD index score is computed as follows: KLD ⫽ (Total strengths of Community –
Total concerns of Community) ⫹ (Total strengths of Corporate Governance – Total
concerns of Corporate Governance) ⫹ (Total strengths of Diversity – Total concerns of
Diversity) ⫹ (Total strengths of Employee Relations – Total concerns of Employee
Relations) ⫹ (Total strengths of Environment – Total concerns of Environment) ⫹
(Total strengths of Human Rights – Total concerns of Human Rights) ⫹ (Total
strengths of Product – Total concerns of Product) ⫺ Any concerns of Alcohol – Any
concerns of Gambling – Any concerns of Firearm – Any concerns of Military – Any
concerns of Nuclear Power – Any concerns of Tobacco.
3.2 Measurement of the primary independent variable – corporate governance scores
ISS developed a measure of corporate governance strength using 61 variables grouped
into the following eight areas:
(1) board structure and composition;
(2) audit issues;
Downloaded by Universitas Muhammadiyah Malang At 20:22 27 March 2015 (PT)
(3)
(4)
(5)
(6)
(7)
(8)
Corporate
governance
and social
responsibility
charter and bylaw provisions;
laws of the state of incorporation;
executive and director compensation;
qualitative factors;
director and officer stock ownership; and
director education.
43
ISS gathers data from public sources, and companies can also provide ISS with updated
or corrected data.
Brown and Caylor (2006, 2009) used the ISS data to create a summary score, known as
Gov-Score, to measure the strength of corporate governance. They selected 51 variables, and
coded each of the 51 variables as either 0 or 1, depending on whether or not ISS considers the
firm’s governance to be minimally acceptable. Brown and Caylor (2006, 2009) then
aggregated those 51 binary variables to create a firm-specific summary score. Thus, a
Gov-Score ranges from 0 to 51. Gov-Scores are generously provided by Brown and Caylor
(2006, 2009). Interested users can freely download the data from their Web site[2].
3.3 Empirical specification
We use the governance score (GOV) and KLD’s social responsibility index score (KLD)
in the following regression models to test the association between corporate governance
and social responsibility (i.e. H1) in equation (1) and to test whether corporate
governance leads to social responsibility (i.e. H2) in equation (2)[3]:
KLDit ⫽ ␣0 ⫹ ␣1*GOVit ⫹ ␣2*SALESit ⫹ ␣3*AGEit ⫹ ␣4*LEVit ⫹ ␣5*ROAit
⫹ ␣6*MTBit ⫹ it
(1)
KLDit ⫽ ␣0 ⫹ ␣1*GOVit ⫹ ␣2*SALESit ⫹ ␣3*AGEit ⫹ ␣4*LEVit ⫹ ␣5*ROAit
⫹ ␣6*MTBit ⫹ it
(2)
Where:
KLDit ⫽ social responsibility index score for firm i in year t;
GOVit ⫽ corporate governance score of firm i in year t;
GOVit-1 ⫽ corporate governance score of firm i in year t-1;
SALESit ⫽ net sales (Compustat Item #12) of firm i in year t;
AGEit ⫽ net property, plant and equipment (Compustat Item #8)/Gross property,
plant and equipment (Compustat Item #7) of firm i in year t;
LEVit ⫽ leverage ratio [total liabilities (Compustat Item #9 ⫹ #34)/total assets
(Compustat Item #6)] of firm i in year t;
ROAit ⫽ return on assets [income before extraordinary items – available for
common equity (Compustat Item #237)/total assets (Compustat Item #6)]
of firm i in year t; and
MTBit ⫽ market-to-book ratio {[common shares outstanding (Compustat Item
#25) ⫻ stock price – fiscal year-end (Compustat Item #199)]/total
common equity (Compustat Item #60)} of firm i in year t.
IJLMA
57,1
Downloaded by Universitas Muhammadiyah Malang At 20:22 27 March 2015 (PT)
44
The social responsibility index score (KLD) is the independent variable of interest. Five
control variables are included to control for firm size, the age of long-term assets,
leverage, return on assets and the market-to-book ratio.
4. Sample selection and descriptive statistics
We obtain the list of firms with corporate Gov-Scores from the Web site described by
Brown and Caylor (2006, 2009). Gov-Scores are available for 3,258 firms as of February
1, 2005. Consistent with Brown and Caylor (2006, 2009), we use the prior year (2004) as
the testing period. Next, we obtain the list of firms with KLD index scores from the KLD
database for 2004 and 2005. KLD contains approximately 3,000 firm observations each
year because the KLD database contains firms on the Russell 3,000 Index. After
matching Gov-Score and KLD observations with Compustat financial data, our final
sample consists of 1,222 firms for 2004 and 1,107 firms for 2005. Panel A of Table I
presents the industry distribution of sample firms for 2004, while Panel B of Table I
reports the industry distribution of sample firms for 2005.
Table II summarizes the sample firms’ descriptive statistics for each of the two years.
Information including mean and median of selected variables is provided. For instance,
the mean values of GOV are 30.64 and 30.67, while the mean values of the KLD score
are ⫺0.43 and ⫺0.29 in Panels A and B, respectively.
Table III reports the Pearson correlation matrix for selected variables in each of the
two years. For each pair of variables, the Pearson correlation coefficient and related
p-value are provided. In general, the results indicate that both GOVt and GOVt-1 are
positively correlated with KLD, total sales, LEV, ROA and ROE. Of particular interest to
this study, GOV is significantly (p ⬍ 0.01) positively correlated with KLD in each of the
Sample selection process
Panel A: Observation Reconciliation
Observations with governance data
Less: observations missing KLD Data
Less: observations missing Compustat Data
Net sample observations
Industry
Panel B: Observation Industry Distribution
Agriculture, forestry and fisheries (SIC 01-09)
Mineral Industries (SIC 10-14)
Construction Industries (SIC 15-17)
Manufacturing Industries (SIC 20-39)
Transportation, communication and utilities (SIC 40-49)
Wholesale (SIC 50-51)
Retail (SIC 52-59)
Financial industries (SIC 60-69)
Service (SIC 70-89)
Table I.
Industry distribution Public administration (SIC 90-99)
of sample firms
Total
No. of
firms 2005
No. of
firms 2004
3,258
(995)
(1,156)
1,107
3,258
(861)
(1,175)
1,222
No. of
firms total
No. of
firms 2005
No. of
firms 2004
9
123
47
1,199
132
66
239
48
461
5
2,329
4
64
23
569
64
32
114
22
213
2
1,107
5
59
24
630
68
34
125
26
248
3
1,222
Downloaded by Universitas Muhammadiyah Malang At 20:22 27 March 2015 (PT)
Variable
Mean
SD
25th percentile
Median
75% percentile
Panel A: 2004 (n ⫽ 1222)
30.64
GOVt
⫺0.43
KLDt
4,477.88
SALESt
525.65
OCFt
2,987.70
COGSt
801.94
XSGAt
5,369.04
TAt
1,574.87
TDt
0.19
LEVt
0.49
AGEt
3.85
MTBt
3.42
ROAt
0.07
ROEt
4.85
1.96
16,873.89
2,290.16
12,415.82
2,845.51
29,612.18
14,698.53
0.17
0.16
7.06
13.33
207.36
27.00
⫺1.00
273.03
19.32
132.28
63.97
336.12
4.29
0.01
0.38
1.74
1.54
3.47
31.00
⫺1.00
803.68
71.82
432.70
162.20
849.30
151.04
0.17
0.49
2.49
4.91
10.07
34.00
0.00
2,445.49
248.62
1,571.31
483.89
2,635.89
600.38
0.30
0.59
3.83
8.78
16.99
Panel B: 2005 (n ⫽ 1107)
30.67
GOVt⫺1
⫺0.29
KLDt
5,264.06
SALESt
590.81
OCFt
3,555.56
COGSt
896.70
XSGAt
5,946.63
TAt
1,698.72
TDt
0.19
LEVt
0.49
AGEt
3.98
MTBt
4.81
ROAt
4.42
ROEt
4.90
2.20
19,928.15
2,611.83
15,042.82
3,082.72
29,544.30
15,042.45
0.17
0.16
7.89
10.26
102.81
27.00
⫺1.00
338.15
29.27
153.88
75.76
410.92
7.47
0.02
0.39
1.76
2.17
4.68
31.00
⫺1.00
985.77
101.79
543.29
188.28
1,027.29
177.01
0.17
0.48
2.55
5.69
11.69
34.00
1.00
3,008.34
316.80
1,957.20
556.00
3,004.07
661.00
0.30
0.59
3.87
9.81
19.21
Corporate
governance
and social
responsibility
45
Notes: Variable definitions: GOVt ⫽ Corporate governance score in year t; GOVt-1 ⫽ Corporate
governance score in year t-1; KLDt ⫽ Social responsibility index score in year t; SALESt ⫽ Net sales
(Compustat Item #12) in year t; OCFt ⫽ Net cash flows from operating activities (Compustat Item #308)
in year t; COGSt ⫽ Cost of goods sold (Compustat Item #41) in year t; XSGAt ⫽ Selling, general and
administrative expenses (Compustat Item #189) in year t; TAt ⫽ Total assets (Compustat Item #6) in
year t; TDt ⫽ Total liabilities (Compustat Item #9 ⫹ #34) in year t; LEVt ⫽ Leverage ratio [total
liabilities (Compustat Item #9 ⫹ #34)/total assets (Compustat Item #6)] in year t; AGEt ⫽ Net property,
plant and equipment (Compustat Item #8)/Gross property, plant and equipment (Compustat Item #7) in
year t; MTBt ⫽ Market to book ratio {[common shares outstanding (Compustat Item #25) ⫻ stock price
– fiscal year-end (Compustat Item #199)]/total common equity (Compustat Item #60)} in year t; ROAt
⫽ Return on assets [income before extraordinary items – available for common equity (Compustat Item
#237)/total assets (Compustat Item #6)] in year t; ROEt ⫽ Return on equity ratio [income before
Table II.
extraordinary items – available for common equity (Compustat Item #237)/common shareholders’ Descriptive statistics
for the sample firms
interest in the company (Compustat Item #60)] in year t.
two years of our sample (i.e. 2004, 2005). The significant correlation between GOV-t and
KLDt in 2004 (Panel A of Table III) suggests that corporate governance is positively
associated with CSR, and the significant correlation between GOVt-1 and KLDt in 2005
(Panel B of Table III) suggests that corporate governance (as of 2004) has a positive
IJLMA
57,1
Downloaded by Universitas Muhammadiyah Malang At 20:22 27 March 2015 (PT)
46
Table III.
Pearson correlation
among selected
variables
Variable
GOV⫺t
KLDt
SALESt
AGEt
LEVt
ROAt
ROEt
Panel A: 2004 (n ⫽ 1222)
KLDt
0.0992
(p-value, two-tailed)
0.0005
SALESt
0.2492
(p-value, two-tailed) ⬍ 0.0001
AGEt
0.0983
(p-value, two-tailed)
0.0006
LEVt
0.1590
(p-value, two-tailed) ⬍ 0.0001
ROAt
0.1630
(p-value, two-tailed) ⬍ 0.0001
ROEt
0.0810
(p-value, two-tailed)
0.0046
MTBt
⫺0.0138
(p-value, two-tailed)
0.6305
0.2820
⬍ 0.0001
0.0558
0.0512
0.1084
0.0001
0.0180
0.5295
0.0161
0.5734
⫺0.0071
0.8038
0.0920
0.0013
0.0706
0.0135
0.0598
0.0366
0.0182
0.5257
⫺0.0140
0.6257
0.3122
⬍ 0.0001
0.0622
0.0299
⫺0.0620
0.0303
⫺0.0075
0.7924
⫺0.0860
0.0026
⫺0.0779
0.0065
0.2244
⬍ 0.0001
0.2751
⬍ 0.0001
⫺0.0083
0.7723
⫺0.0530
0.0638
Panel B: 2005 (n ⫽ 1107)
KLDt
0.1097
(p-value, two-tailed)
0.0003
SALESt
0.2420
(p-value, two-tailed) ⬍ 0.0001
AGEt
0.0460
(p-value, two-tailed)
0.1256
LEVt
0.0848
(p-value, two-tailed)
0.0047
ROAt
0.1588
(p-value, two-tailed) ⬍ 0.0001
ROEt
0.0704
(p-value, two-tailed)
0.0192
MTBt
⫺0.0395
(p-value, two-tailed)
0.1893
0.2847
⬍ 0.0001
⫺0.0383
0.2037
0.0621
0.0390
0.0281
0.3505
0.0240
0.4246
⫺0.0090
0.7642
0.0860
0.0042
0.0433
0.1501
0.0711
0.0181
0.0326
0.2784
⫺0.0203
0.5003
0.3003
⬍ 0.0001
0.0522
0.0826
0.0454
0.1313
⫺0.0213
0.4785
⫺0.2076
⬍ 0.0001
⫺0.2005
⬍ 0.0001
0.2627
⬍ 0.0001
0.4280
⬍ 0.0001
⫺0.1546
⬍ 0.0001
⫺0.6777
⬍ 0.0001
Notes: Variable Definitions: GOVt ⫽ Corporate governance score in year t; GOVt-1 ⫽ Corporate
governance score in year t-1; KLDt ⫽ Social responsibility index score in year t; SALESt ⫽ Net sales
(Compustat Item #12) of firm i in year t; AGEt ⫽ Net property, plant and equipment (Compustat
Item #8)/Gross property, plant and equipment (Compustat Item #7) in year t; LEVt ⫽ Leverage ratio
[total liabilities (Compustat Item #9 ⫹ #34)/total assets (Compustat Item #6)] in year t; ROAt ⫽ Return
on assets [income before extraordinary items – available for common equity (Compustat Item #237)/
total assets (Compustat Item #6)] in year t; ROEt ⫽ Return on equity ratio [ income before extraordinary
items – available for common equity (Compustat Item #237)/common shareholders’ interest in the
company (Compustat Item #60)] in year t; MTBt ⫽ Market to book ratio {[common shares outstanding
(Compustat Item #25) ⫻ stock price – fiscal year-end (Compustat Item #199)]/total common equity
(Compustat Item #60)} in year t.
impact on future social responsibility performance (as of 2005). Overall, results in
Table III provide initial evidence supporting our two hypotheses.
5. Results
We use regression analyses to further test our hypotheses. The regression model in
equation (1) is used to test our first hypothesis and results are reported in Panel A of
Downloaded by Universitas Muhammadiyah Malang At 20:22 27 March 2015 (PT)
Table IV. Panel B reports results from the regression analysis using equation (2) to test
our second hypothesis. As shown in Panel A of Table IV, the current year’s governance
coefficient (␣1) is positive (0.0427) and significant (p ⫽ 0.0004) which supports our first
hypothesis of a positive association between corporate governance and social
responsibility. Panel B reports that the lagged governance coefficient (␣1) is also positive
(0.0538) and strongly significant (p ⫽ 0.0001) which supports our second hypothesis that
good governance leads to good social responsibility. Our regression results provide
significant evidence (p ⬍ 0.01) to support these two hypotheses. Overall, good corporate
governance is positively associated with good social responsibility performance and
leads to good social responsibility performance.
The regression analyses include five control variables. In particular, we include
ROA as a control variable, as Brown and Caylor (2009) report a significantly positive
association between GOV and ROA. Panel A of Table IV reports a significantly
positive relation between CSR (KLD) and ROA and MTB, and a significantly
negative association between KLD and LEV. Panel B of Table IV reports a
significantly negative relation between CSR (KLD) and AGE and LEV and a
SE
t value
p ⬎ ItI
Panel A: 2004; n ⫽ 1222; Adjusted R2 ⫽ 0.0226
Intercept
⫺1.4344
GOV
0.0427
SALES
1.54E-06
AGE
⫺0.4334
LEV
⫺1.0504
ROA
0.0086
MTB
0.0176
0.3973
0.0121
3.40E-06
0.3692
0.3503
0.0043
0.0081
⫺3.61
3.52
0.45
⫺1.17
⫺3.00
2.03
2.17
0.0003*
0.0004*
0.6500
0.2406
0.0028*
0.0427**
0.0299**
Panel B: 2005; n ⫽ 1107; Adjusted R2 ⫽ 0.0379
Intercept
⫺1.2340
GOV
0.0538
SALES
⫺4.34E-07
AGE
⫺1.1545
LEV
⫺1.4372
ROA
0.0108
MTB
0.0229
0.4664
0.0139
3.37E-06
0.4365
0.4177
0.0067
0.0086
⫺2.66
3.87
⫺0.13
⫺2.64
⫺3.44
1.62
2.66
0.0080*
0.0001*
0.8975
0.0083*
0.0006*
0.1057
0.0079*
Variable
Parameter estimate
Notes: Significance level: * p ⱕ 0.01, ** p ⱕ 0.05, *** p ⱕ 0.1; Model: KLDit ⫽ ␣0 ⫹ ␣1 ⫻ GOVit ⫹
␣2 ⫻ SALESit ⫹ ␣3 ⫻ AGEit⫹ ␣4 ⫻ LEVit ⫹ ␣5 ⫻ ROAit ⫹ ␣6 ⫻ MTBit ⫹ ⑀it; Model: KLDit ⫽ ␣0 ⫹ ␣1 ⫻
GOVit-1 ⫹ ␣2 ⫻ SALESit ⫹ ␣3 ⫻ AGEit⫹ ␣4 ⫻ LEVit ⫹ ␣5 ⫻ ROAit ⫹ ␣6 ⫻ MTBit ⫹ ⑀it; Variable
Definitions:; KLDit ⫽ Social responsibility index score for firm i in year t; GOVit ⫽ Corporate governance
score of firm i in year t; GOVit⫺1 ⫽ Corporate governance score of firm i in year t⫺1; SALESit ⫽ Net
sales (Compustat Item #12) of firm i in year t; AGEit ⫽ Net property, plant and equipment (Compustat
Item #8)/Gross property, plant and equipment (Compustat Item #7) of firm i in year t; LEVit ⫽ Leverage
ratio [total liabilities (Compustat Item #9 ⫹ #34)/total assets (Compustat Item #6)] of firm i in year t;
ROAit ⫽ Return on assets [income before extraordinary items – available for common equity
(Compustat Item #237)/total assets (Compustat Item #6)] of firm i in year t; MTBit ⫽ Market to book
ratio {[common shares outstanding (Compustat Item #25) ⫻ stock price – fiscal year-end (Compustat
Item #199)]/total common equity (Compustat Item #60)} of firm i in year t.
Corporate
governance
and social
responsibility
47
Table IV.
Regression analysis
IJLMA
57,1
Downloaded by Universitas Muhammadiyah Malang At 20:22 27 March 2015 (PT)
48
significantly positive association between KLD and MTB. In addition, we also
checked the variance inflation factors (VIFs) and multicollinearity is not an issue in
our models.
6. Supplemental tests
To test the robustness of our results to alternative corporate governance measures, we
reran our empirical tests using KLD’s net governance score instead of Brown and
Caylor’s (2006, 2009) governance score. As shown in Panel A of Table V, the current
year’s governance coefficient (␣1) is positive (0.2467) and significant (p ⫽ 0.0018) which
supports our first hypothesis of a positive association between corporate governance
and social responsibility. Panel B reports that the lagged governance coefficient (␣1) is
positive (0.0141), as expected, but insignificant (p ⫽ 0.8803). The control variables have
similar signs to Table IV. In general, ROA and MTB are positive and AGE and LEV are
negative. In summary, the additional regression results in Table V provide strong
support for our first hypothesis and insignificant support for our second hypothesis.
SE
t value
p ⬎ ItI
Panel A: 2004; n ⫽ 1222; Adjusted R ⫽ 0.0206
Intercept
⫺0.2067
KLDGOV
0.2467
SALES
2.55E-06
AGE
⫺0.4493
LEV
⫺0.8708
ROA
0.0103
MTB
0.0153
0.1810
0.0787
3.36E-06
0.3697
0.3464
0.0042
0.0081
⫺1.14
3.13
0.76
⫺1.22
⫺2.51
2.45
1.89
0.2536
0.0018*
0.4485
0.2245
0.0121**
0.0145**
0.059***
Panel B: 2005; n ⫽ 1107; Adjusted R2 ⫽ 0.0248
Intercept
0.3580
KLDGOV
0.0141
SALES
2.48E-06
AGE
⫺1.1888
LEV
⫺1.2516
ROA
0.0150
MTB
0.0215
0.2186
0.0938
3.33E-06
0.4394
0.4190
0.0066
0.0087
1.64
0.15
0.74
⫺2.71
⫺2.99
2.26
2.47
0.1018
0.8803
0.4574
0.0069*
0.0029*
0.0238**
0.0135**
Variable
Parameter estimate
2
Table V.
Additional
regression test
Notes: Significance level: * p ⱕ 0.01, ** p ⱕ 0.05, *** p ⱕ 0.1; Model: KLDit ⫽ ␣0 ⫹ ␣1*KLDGOVit ⫹
␣2*SALESit ⫹ ␣3*AGEit⫹ ␣4*LEVit ⫹ ␣5*ROAit ⫹ ␣6*MTBit ⫹ ⑀it; Model: KLDit ⫽ ␣0 ⫹
␣1*KLDGOVit⫺1 ⫹ ␣2*SALESit ⫹ ␣3*AGEit⫹ ␣4*LEVit ⫹ ␣5*ROAit ⫹ ␣6*MTBit ⫹ ⑀it; Variable
Definitions: KLDit ⫽ Social responsibility index score for firm i in year t; KLDGOVit ⫽ Corporate
governance index score in KLD database of firm i in year t; KLDGOVit-1 ⫽ Corporate governance index
score in KLD database of firm i in year t-1; SALESit ⫽ Net sales (Compustat Item #12) of firm i in year
t; AGEit ⫽ Net property, plant and equipment (Compustat Item #8)/Gross property, plant and
equipment (Compustat Item #7) of firm i in year t; LEVit ⫽ Leverage ratio [total liabilities (Compustat
Item #9 ⫹ #34)/total assets (Compustat Item #6)] of firm i in year t; ROAit ⫽ Return on assets [income
before extraordinary items – available for common equity (Compustat Item #237)/total assets
(Compustat Item #6)] of firm i in year t; MTBit ⫽ Market to book ratio {[common shares outstanding
(Compustat Item #25) ⫻ stock price – fiscal year-end (Compustat Item #199)]/total common equity
(Compustat Item #60)} of firm i in year t.
Downloaded by Universitas Muhammadiyah Malang At 20:22 27 March 2015 (PT)
7. Conclusion
In this study, we posit that corporate governance is positively associated with CSR. In
addition, good corporate governance has a positive impact on future social
responsibility. We examine the association between corporate governance (in 2004) and
CSR (in 2004 and 2005). Regression analyses document a positive and significant
(p ⬍ 0.01) association between corporate governance and CSR for both hypotheses.
Results from Pearson correlation tables also confirm this significant and positive
association. For the most part, the results are robust to alternative corporate governance
measures. The results suggest that business entities with strong corporate governance
mechanisms have good social responsibility performance, and good governance also
leads to good social responsibility performance. These documented CSR performance
benefits further support corporate governance improvement efforts in US corporations.
Future work can continue to examine the relationship between corporate governance
mechanisms and CSR performance. What corporate governance attributes affect CSR
performance? What specific dimensions of CSR performance are affected most by
corporate governance? This additional work will help us better understand the
relationship between corporate governance and CSR performance, another growing and
important dimension of overall corporate performance.
Notes
1. www.kld.com/indexes/ssindex/faq.html
2. http://robinson.gsu.edu/accountancy/gov_score.html
3. H1: KLDi, 2004 ⫽ f(GOVi, 2004; control variablesi, 2004) H2: KLDi, 2005 ⫽ f(GOVi, 2004; control
variablesi, 2005).
References
Abdel-Khalik, A. (2002), “Reforming corporate governance post Enron: shareholder’s board of
trustees and the auditor”, Journal of Accounting and Public Policy, Vol. 21 No. 2, pp. 97-103.
Beurden, P. and Gossling, T. (2008), “The worth of values – a literature review on the relation
between corporate social and financial performance”, Journal of Business Ethics, Vol. 82
No. 2, pp. 407-424.
Bronson, S.N., Carcello, J.V., Hollingsworth, C.W. and Neal, T.L. (2009), “Are fully independent
audit committees really necessary?”, Journal of Accounting and Public Policy, Vol. 28 No. 4,
pp. 265-280.
Brown, L. and Caylor, M.L. (2006), “Corporate governance and firm valuation”, Journal of
Accounting and Public Policy, Vol. 25 No. 4, pp. 409-434.
Brown, L. and Caylor, M.L. (2009), “Corporate governance and firm operating performance”,
Review of Quantitative Finance and Accounting, Vol. 32 No. 2, pp. 129-144.
Byard, D., Li, Y. and Weintrop, J. (2006), “Corporate governance and the quality of financial
analysts’ information”, Journal of Accounting and Public Policy, Vol. 25 No. 5, pp. 609-625.
Chen, C., Pattern, D. and Roberts, R. (2008), “Corporate charitable contributions: a corporate social
performance or legitimacy strategy?”, Journal of Business Ethics, Vol. 82 No. 1, pp. 131-144.
Cho, C., Pattern, D. and Roberts, R. (2006), “Corporate political strategy: an examination of the
relation between political expenditures, environmental performance, and environmental
disclosure”, Journal of Business Ethics, Vol. 67 No. 2, pp. 139-154.
Corporate
governance
and social
responsibility
49
IJLMA
57,1
Downloaded by Universitas Muhammadiyah Malang At 20:22 27 March 2015 (PT)
50
Cochran, R. and Wood, R. (1984), “Corporate social responsibility and financial performance”,
Academy of Management Journal, Vol. 27 No. 1, pp. 42-56.
Deckop, J.R., Merriman, K.K. and Gupta, S. (2006), “The effect of CEO pay structure on corporate
social performance”, Journal of Management, Vol. 32 No. 3, pp. 329-342.
DeZoort, F.T., Hermanson, D.R. and Houston, R.W. (2003), “Audit committee support for auditors:
the effects of materiality justification and accounting precision”, Journal of Accounting and
Public Policy, Vol. 22 No. 2, pp. 175-199.
Dhaliwal, D., Li, O., Tsang, A. and Yang, Y. (2011), “Voluntary nonfinancial disclosure and the
cost of equity capital: the initiation of corporate social responsibility reporting”, The
Accounting Review, Vol. 86 No. 1, pp. 59-100.
Dhaliwal, D., Radhakrishnan, S., Tsang, A. and Yang, Y. (2012), “Nonfinancial disclosure and
analyst forecast accuracy: international evidence on corporate social responsibility
disclosure”, The Accounting Review, Vol. 87 No. 3, pp. 723-759.
Earnhart, D. (2002), “Effects of ownership and financial status on corporate environmental
performance”, Working paper, University of Kansas, Kansas.
European Commission (EC) (2002), “Green book: promoting a European framework for corporate
social responsibility”, available at: http://europa.eu.int/comm/employment_social/soc-dial/
csr/greenpaper.htm
Freeman, R.E. (1984), Strategic Management: A Stakeholder Approach, Pitman, Boston, MA.
Graves, S. and Waddock, S.A. (1994), “Institutional owners and corporate social performance”,
Academy of Management Journal, Vol. 18 No. 1, pp. 303-317.
Griffin, J.J. and Mahon, J.F. (1997), “The corporate social performance and corporate financial
performance debate: twenty-five years of incomparable research”, Business and Society,
Vol. 36 No. 1, pp. 5-31.
Gul, F.A. and Leung, S. (2004), “Board leadership, outside directors’ expertise and voluntary
corporate disclosures”, Journal of Accounting and Public Policy, Vol. 23 No. 5, pp. 351-379.
Hill, C.W. and Jones, T. (1992), “Stakholder-agency theory”, Journal of Management Studies,
Vol. 29 No. 2, pp. 131-154.
Jaggi, B., Leung, S. and Gul, F. (2009), “Family control, board independence and earnings
management: evidence based on Hong Kong firms”, Journal of Accounting and Public
Policy, Vol. 28 No. 4, pp. 281-300.
Johnson, R.A. and Greening, D.W. (1999), “The effects of corporate governance and institutional
ownership types on corporate social performance”, Academy of Management Journal,
Vol. 42 No. 5, pp. 564-576.
Kanagaretnam, K., Lobo, G.J. and Whalen, D.J. (2007), “Does good corporate governance reduce
information asymmetry around quarterly earnings announcements?”, Journal of
Accounting and Public Policy, Vol. 26 No. 4, pp. 497-522.
Kelton, A.S. and Yang, Y. (2008), “The impact of corporate governance on internet financial
reporting”, Journal of Accounting and Public Policy, Vol. 27 No. 1, pp. 62-87.
Kim, Y., Park, M.S. and Wier, B. (2012), “Is earnings quality associated with corporate social
responsibility”, The Accounting Review, Vol. 87 No. 3, pp. 761-796.
McGuire, J., Sundgren, A. and Schneeweis, T. (1988), “Corporate social responsibility and firm
financial performance”, Academy of Management Journal, Vol. 31 No. 4, pp. 854-872.
Nelling, E. and Webb, E. (2009), “Corporate social responsibility and financial performance: the
virtuous circle revisited”, Review of Quantitative Finance and Accounting, Vol. 32 No. 2,
pp. 197-209.
Downloaded by Universitas Muhammadiyah Malang At 20:22 27 March 2015 (PT)
Riyanto, Y. and Toolseman, L. (2007), “Corporate social responsibility in a corporate governance
framework”, Working paper, National University of Singapore.
Roman, R., Hayibor, S. and Agle, B. (1999), “The relationship between social performance and
financial performance”, Business and Society, Vol. 38 No. 1, pp. 109-125.
Ruf, B.M., Muralidhar, K., Brown, R.M., Janney, J.J. and Paul, K. (2001), “An empirical
investigation of the relationship between change in corporate social performance and
financial performance: a stakeholder theory perspective”, Journal of Business Ethics, Vol. 32
No. 2, pp. 148-156.
Shropshire, C. and Hillman, A. (2007), “A longitudinal study of significant change in stakeholder
management”, Business and Society, Vol. 46 No. 1, pp. 63-87.
Stuebs, M. and Sun, L. (2010), “Corporate governance and environmental performance”, Journal of
Accounting, Ethics and Public Policy, Vol. 11 No. 3, pp. 381-395.
Tsoutsoura, M. (2004), “Corporate social responsibility and financial performance: the ‘virtuous
circle’ revisited”, Working Paper, University of California, Berkeley.
Vilanova, M., Lozano, J. and Arenas, D. (2009), “Exploring the nature of the relationship between
CSR and competitiveness” Journal of Business Ethics, Vol. 87 No. 1, pp. 57-69.
Waddock, S. (2003), “Myths and realities of social investing”, Organization and Environment,
Vol. 16 No. 3, pp. 369-380.
Waddock, S. and Graves, S. (1997), “The corporate social performance – financial performance
link”, Strategic Management Journal, Vol. 18 No. 4, pp. 303-319.
Corresponding author
Li Sun can be contacted at: lis560@utulsa.edu
Corporate
governance
and social
responsibility
51
IJLMA
57,1
Appendix
Category
Strengths
Concerns
Community
generous giving
innovative giving
housing support
education support
peoples relations
non-US giving
voluntary programs
other strengths
limited compensation
ownership strength
transparency strength
accountability strength
public policy strength
other strengths
CEO
promotion
board of directors
work-life benefits
women and minority
employment of the disabled
gay and lesbian policies
other strengths
union relations
no-layoff policy
cash profit sharing
employee involvement
retirement benefits
health and safety
other strengths
beneficial products
pollution prevention
recycling
clean energy
property, plant and equipment
other strengths
investment controversies
negative economic impact
indigenous people relations
tax disputes
other concerns
Downloaded by Universitas Muhammadiyah Malang At 20:22 27 March 2015 (PT)
52
Corporate governance
Diversity
Employee relations
Environment
Human rights
Table AI.
Products
List of the strengths
and concerns in KLD
database
positive record in S. Africa
indigenous people relations
labor rights strength
other strengths
quality
R&D, innovation
benefits to economically disadvantages
other strengths
high compensation
ownership concern
transparency concern
accountability concern
public policy concern
other concerns
controversies
non-representation
other concerns
union relations
health and safety concern
workforce reductions
retirement benefits concern
other concerns
hazardous waste
regulatory problems
ozone depleting chemicals
substantial emissions
agriculture chemicals
climate change
other concerns
S. Africa
Northern Ireland
Burma concern
Mexico
labor right concern
indigenous people relations concern
other concerns
product safety concern
marketing-contracting concern
antitrust
other concerns


© Copyright 2025