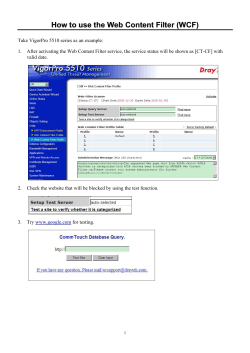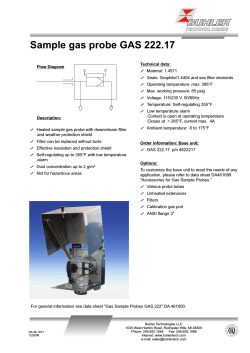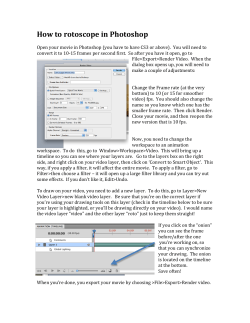
Improved Method for the Analysis of 31 Drugs of Abuse/Pain
Improved Method for the Analysis of 31 Drugs of Abuse/Pain Management Panel in Oral Fluid Samples using the Thomson eXtreme® Filter Vials by LC-MS/MS Nadine Koenig1, Crystal Xander1, Melanie Stauffer1, Dean Fritch2, Lisa Wanders3, Sam Ellis3 1 Health Network Laboratories, 794 Roble Road, Allentown, PA 18109 2 OraSure Technologies, Inc. 150 Webster Street, Bethlehem, PA 18015 3Thomson Instrument Company, 1121 South Cleveland Street Oceanside, CA 92054 Abstract Result The goal of this study was to improve the sample preparation for the analysis of drugs of abuse/pain The improved method utilizes the Thomson eXtreme Filter Vials for sample clean-up significantly reducing the cost and time of per sample analysis. This method was validated for all the analytes in Table management panels in oral fluids. The oral fluid samples were collected with Intercept® i2he™ Oral Fluid 1. Mass spectrum of all the analytes in Table 1 can be seen in Fig. 5. Table 2 shows the 4 drugs that were Collection Devices. The diluted oral fluid samples were filtered using Thompson Filter Vials, followed by analyzed in oral fluid by the obsoleted method. Table 3 shows the transitions used to validate the LC/MS/MS analysis. The most critical aspects of reliable Oral Fluid analysis are the reduction of interferences improved method. Linearity of the assay for the drugs listed in Table 1 is displayed in Table 4. Table 5 shows ion suppression and drug recovery for analytes in table 1. Unextracted standards (neats) were run from the sample matrix and analyte recovery. Traditionally, SPE, SLE and centrifugation have been used to along with 3 different negative patient samples, extracted and spiked with standard and internal reduce matrix interference prior to MS analysis. However, these techniques are time consuming, adversely standard post extraction at the cutoff concentration to access ion suppression and drug recovery. To impact recovery, require expensive consumables and equipment and use large amounts of solvent. Thomson calculate drug recovery, the mean area counts of the extracted samples was compared to the mean area counts of the unextracted samples. To determine ion suppression, the mean concentration of the eXtreme® Filter Vials (patented) offer multi-layer filtration for viscous samples and samples containing up to 30% extracted samples was compared to the mean concentration of the post-extracted samples. solid particulates. The following 31 drugs in oral fluid will be analyzed by this “Improved Method”: Experimental Obsolete Method: 4 drugs Caliper Life Sciences Turbo-Vap® Concentration Workstation Rapid Trace® Solid Phase Extraction Workstation Vortex Mixer AB Sciex 3200 Mass Spectrometer Shimadzu Prominence HPLC o Autosampler: SIL-20AC HT o Pumps A & B: LC-20AD o Communication Bus Module: CBM-20A o Column Oven: CTO-20AC o Degasser: DGU-20A5 Morphine and BZE o Column: Restek Ultra Biphenyl (5µm, 50 x 2.1mm) Mobile Phases: A: 0.1% Formic Acid in HPLC Grade Water B. 0.1% Formic Acid in HPLC Grade Methanol Flow rate: 0.5 mL/min Injection Volume = 30l PCP and Methadone o Column: Restek Allure Biphenyl (5µm 50 x 2.1mm) Mobile Phases (Isocratic 10% Water in Methanol): A: 0.1% Formic Acid in HPLC Grade Water B. 0.1% Formic Acid in HPLC Grade Methanol Flow rate: 0.3 mL/min Injection Volume: 30l This validated method alleviates the need for sample clean-up by SPE or SLE thereby reducing the amount of equipment required, solvent usage and sample preparation time. Samples are filtered by pipetting the sample into the filter vial shell, inserting the plunger into the shell, and then pushing the plunger into the shell. The filtration process from sample pipetting to autosampler ready only requires Ion Suppression (%) Collected Sample Drug Recovery (% Neat) Calibrator Collected Sample 15 seconds. Benefits to the use of Thomson eXtreme® Filter Vials include lower cost, faster sample Calibrator preparation time, less use and disposal of organic solvents. Amphetamine 7 3 70 76 Methamphetamine 3 1 69 52 3,4-Methylenedioxyamphetamine 5 5 79 85 3,4-Methylenedioxy-methamphetamine 4 5 69 73 7-Aminoclonazepam 3 -6 77 80 Clonazepam -11 0 72 75 New Method Benefits Alprazolam 12 0 41 46 Method # of Samples OH-Alprazolam 7 -1 66 72 Diazepam 24 10 30 40 SPE 96 Nordiazepam 4 3 47 51 Temazepam 12 -1 40 51 SLE Filter Vial 96 96 Oxazepam -3 -4 77 77 Lorazepam -7 -5 85 86 Zolpidem 11 -2 50 48 Cocaine 7 9 38 45 Benzoylecgonine 8 2 78 76 Methadone 31 18 36 36 Codeine 10 5 109 115 Morphine 7 7 83 97 Hydrocodone 8 6 85 94 Hydromorphone 7 6 109 110 Oxycodone 6 -1 92 100 Oxymorphone 6 7 100 103 6-Acetylmorphine 5 2 100 125 Phencyclidine 5 7 47 51 Buprenorphine 3 6 60 76 Norbuprenorphine 5 -1 74 94 Fentanyl 10 2 50 54 Norfentanyl 4 3 86 86 Carisoprodol -15 -1 70 78 Fig. 1 Calibration curves for 3,4-Methylenedioxyamphetamine, 3,4-Methylenedioxy-methamphetamine, Amphetamine, Methamphetamine . Correlation Coefficients are > 0.99. 4000 3000 2000 1000 0 0 1000 2000 3000 4000 5000 CONCENTRATION OF STANDARDS, NG/ML 6000 Fig. 3 Calibration curves for Lorazepam, Nordiazepam, Oxazepam, Temazepam. Correlation Coefficients are > 0.99. AVERAGE CALCULATED CONCENTRATION, N = 3 3,4-Methylenedioxyamphetamine - r2 = 0.9997 3,4-Methylenedioxy-methamphetamine - r2 = 0.9997 Amphetamine - r2 = 0.9999 Methamphetamine - r2 = 0.9999 5000 Lorazepam - r2 = 0.9982 Nordiazepam - r2 = 0.9986 Oxazepam - r2 = 0.9992 Temazepam - r2 = 0.9988 250 200 150 100 50 0 0 htslabs.com | folks@htslabs.com | 800 541.4792 | 760 757.8080 | 760 757.9367 50 100 150 200 250 CONCENTRATION OF STANDARDS, NG/ML 300 300 Maintenance/Annually Volume Solvent used Solvent Disposal ~$150,000.00 $15,000.00 1920 mL 1824 mL ~$11,400.00 $500.00 ~$100.00 $0.00 76.8 mL < 2 mL 0 mL (it gets dried down) 0 mL 7-Aminoclonazepam - r2 = 0.9996 Alprazolam - r2 = 0.9989 Clonazepam - r2 = 0.9986 Diazempam - r2 = 0.9985 OH-Alprazolam - r2 = 0.9992 250 200 150 100 50 0 0 50 100 150 200 250 CONCENTRATION OF STANDARDS, NG/ML 300 Acknowledgements Fig. 4 Calibration curve for Cocaine. Correlation Coefficients are > 0.99 Calibration Curves 0.50ng/mL 250ng/mL 300 Equipment Cost Calibration Curves 1ng/mL - 250ng/mL Calibration Curves 10ng/mL -5000ng/mL 6000 Time to complete 150 min. + 20 min. dry down/reconstitute 35 min. 4 min. Fig. 2 Calibration curves for 7-Aminoclonazepam, Alprazolam, Clonazepam, Diazempam, OH-Alprazolam , . Correlation Coefficients are > 0.99. AVERAGE CALCULATED CONCENTRATION, N = 3 8. Extracts are ready for LC/MS/MS analysis using the Shimadzu / AB Sciex 4500 Obsolete Sample Preparation: 1. Allow standards, specimens and control to come to room temperature. 2. To appropriately labeled 13 x 100 mm tubes add 3 mL of 50mM Phosphoric Acid. 3. Prepare the 13 x 100 mm tubes for analysis. Standards/Controls/Patient Samples 4. Vortex for 10 seconds. 5. The tubes are now ready for automated extraction using on the Caliper Life Sciences Turbo-Vap® Concentration Workstation 6. After the elution is complete on the Rapid Trace®, remove the racks with the tubes intact. 7. Add 50µL of 1% HCL in Methanol to each tube. 8. Vortex for 15 seconds. 9. The original sample tubes and the used SPEC DAU Columns can be discarded. 10. Take to dryness at 55οC in the Caliper Life Sciences Turbo-Vap®. 11. Reconstitute samples by adding 1 mL of 10% HPLC Grade Methanol in Water to all tubes. 12. Vortex for 15 seconds. 13. Extracts are ready for LC/MS/MS analysis using the Shimadzu / AB Sciex 3200 Conclusion AVERAGE CALCULATED CONCENTRATION, N = 4 Improved Sample Preparation: 1. Allow standards, specimens and control to come to room temperature. 2. Add 100 µL of 10% Methanol / Water 3. Add 100 µL of Standard (Intercept i2he Diluent)/ Control/oral fluid sample + 10uL Internal Standard 4. Place Thomson Filter Plunger on top of the Thomson vial, Thomson vials –eXtreme/FV® 0.2m PVDF, w/Pre-Slit Red Cap (p/n #85531) 5. Press filter plunger down approximately ¼ of the way into each of the Thomson Vial outer shells. 6. Vortex for 10 seconds using the Eppendorf MixMate®. 7. Press Filter plunger the rest of the way down using the Thomson 48 position Vial Filter Press. Final concentrations for the various analytes are as follows AVERAGE CALCULATED CONCENTRATION, N = 3 Improved Method: 31 drugs • Orasure Technologies Intercept® i2he™ Oral Fluid Collection Device (p/n 3001-2673) • Orasure Technologies Intercept i2he Diluent (p/n 1001-0384) • Thomson eXtreme|FV® 0.2µm PVDF (p/n 85531) • Thomson 48 position Vial Filter Press (p/n 35010) Thomson 48 position Vial Filter Press (Part # 35010) Eppendorf MixMate® AB Sciex 4500 Mass Spectrometer Shimadzu Prominence HPLC equipped with: o Autosampler: SIL-20AC HT o Pumps A, B: LC-20AD o Communication Bus Module: CBM-20A o Column Oven: CTO-20A o Degasser: DGU-20A5R 31 Analytes, see Table 1: o Column: Restek Ultra Biphenyl Columns (5µm, 50 x 2.1 mm) Mobile Phases: A: 0.1% Formic Acid in HPLC Water B: 0.1% Formic Acid in Methanol Flow Rate: 0.5 mL/min Injection Volume: 15µL Run-Time: 8 minutes 1200 Calibration Curves 2ng/mL - 1000ng/mL Health Network Laboratories - Nadine Koenig, Crystal Xander, Melanie Stauffer OraSure Technologies, Inc – Dean Fritch Cocaine - r2 = 0.9999 1000 800 Disclaimer 600 400 200 0 0 200 400 600 800 1000 CONCENTRATION OF STANDARDS, NG/ML 1200 Thomson Instrument Company is not affiliated with OraSure Technologies, Inc®, Health Network Laboratories®, Caliper Life Sciences®, AB Sciex® or their products
© Copyright 2025


