
CESifo Working Paper no. 5337
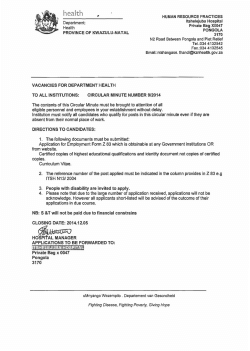
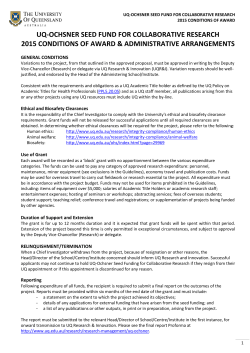
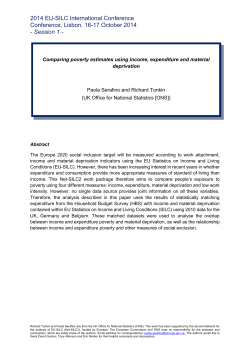
The Growth in Military Expenditure
in Germany 1951-2011:
Did Parties Matter?
Björn Kauder
Niklas Potrafke
CESIFO WORKING PAPER NO. 5337
CATEGORY 2: PUBLIC CHOICE
APRIL 2015
An electronic version of the paper may be downloaded
• from the SSRN website:
www.SSRN.com
• from the RePEc website:
www.RePEc.org
• from the CESifo website:
www.CESifo-group.org/wp
T
ISSN 2364-1428
T
CESifo Working Paper No. 5337
The Growth in Military Expenditure
in Germany 1951-2011:
Did Parties Matter?
Abstract
We examine whether government ideology was correlated with the growth in military
expenditure in Germany over the period 1951-2011. By using various measures of government
ideology, the results do not show any effect. The exception is an ideology measure based on the
Comparative Manifesto Project (Left-Right scale): using this measure, the results show that the
growth in military expenditure increased by about 2.4 percentage points, when the ideology
variable (right-wing) increased by one standard deviation. This effect, however, is based on
observations until the early 1960s and cannot be generalized. The major political parties agreed
on how to evaluate international risks and threats. Government ideology retired to the
background. We conjecture that the consensus among the major parties will persist – even if
military spending needs to be increased in response to new international risks and threats.
JEL-Code: D720, H000.
Keywords: military expenditure, partisan politics, economic policy-making, Germany.
Björn Kauder
Ifo Institute – Leibniz Institute for
Economic Research
at the University of Munich
Poschingerstrasse 5
Germany – 81679 Munich
kauder@ifo.de
Niklas Potrafke
Ifo Institute – Leibniz Institute for
Economic Research
at the University of Munich
Poschingerstrasse 5
Germany – 81679 Munich
potrafke@ifo.de
24 April 2015
This paper has been accepted for publication in Defence and Peace Economics.
1. Introduction
Economic theories suggest that government ideology is correlated with military expenditure.
The partisan approaches claim that left-wing governments pursue more expansionary
economic policies than right-wing governments (Hibbs 1977; Alesina 1987). Expansionary
economic policies include a large size of government. Left-wing governments may thus also
endorse military expenditure, especially when they recruit additional military personnel and
employees who are not competitive in the labour market. By recruiting non-competitive
employees or reintegrating unemployed individuals in the labour market, left-wing governments gratify their constituencies. 1 By contrast, right-wing governments and their electorates
tend to endorse security and support the hierarchies and discipline that are associated with
armed forces. In a similar vein, right-wing governments advocate interventionist (hawkish) or
even imperialist foreign policies, and left-wing governments advocate dovish foreign policies
(see Whitten and Williams 2011). The extent to which government ideology is correlated with
military expenditure thus remains an undetermined empirical question.
Empirical studies examining how government ideology is correlated with military
expenditure arrive at ambiguous conclusions. Bove et al. (2014) used data for 22 OECD
countries over the 1988-2009 period. The results show that growth in military expenditure
was higher under right-wing governments. Using panel data for 23 OECD countries over the
1970-1997 period and 20 OECD countries over the 1990-2006 period, the results of Potrafke
(2011) do not suggest any effect of government ideology on growth in military expenditure.
Whitten and Williams (2011) put a question mark over the left-right scale. Using panel data
for 19 industrialized countries (including Turkey) over the 1952-1997 period, the results show
1
Tridimas (2015) describes that in ancient Athens, war meant redistribution benefitting the poor at the expense
of the rich who bore a disproportionate burden of the war. Governments may well increase military expenditure
to stimulate the economy (‘Military Keynesianism’; see, for example, Griffin et al. 1982).
2
that hawkish governments and governments that endorse the welfare state increased military
expenditure. 2
It is conceivable that previous panel-data studies did not show strong ideologyinduced effects because in European countries ‘there is very little uniformity in the factors
that determine each country’s demand for military expenditure’ (Nikolaidou 2008, 273). In
particular, government ideology is an excellent case in point. Single-country studies have
shown that in countries such as Greece and Sweden military expenditure was somewhat
higher under left-wing governments, while in the United Kingdom, the Netherlands, and
Turkey military expenditure was higher under right-wing governments and legislatures.
Evidence for the United States is mixed (see Kollias and Paleologou 2003; Eichenberg and
Stoll 2003; Karagol and Turhan 2008; Dalen and Swank 1996; Wlezien 1996; Nincic and
Cusack 1979; Correa and Kim 1992).
We examine how government ideology was correlated with the growth in military
expenditure in Germany. There have been three previous studies referring to that issue. 3
Eichenberg and Stoll (2003) used data from the late 1960s until 1998 and show that the
change in military expenditure was somewhat lower, the higher the percentage of
conservative legislatures. The authors proposed that the social-democratic chancellor Helmut
Schmidt (in office 1974-1982) was one of the left-wing ‘proponents of a strong defense – or
at least proponents of a balanced commitment to defense and negotiation’. Moreover: ‘… that
the end of the cold war and the consequent reductions in defense spending occurred in some
prominent cases under Conservatives: … Kohl …’ (p. 413). Maneval (1994) used data over
the 1960-1990 period, included ‘a dummy-variable for the change of coalition’ and concluded
that ‘the political variable practically does not help to explain the volume of West German
defense expenditure; from this can be concluded that during the Cold War a broad consensus
2
Strauss (2015) examines whether government ideology influences arms races.
Bayer and Naunheim (2014) describe how German military expenditure is composed, but do not relate to
government ideology.
3
3
on defense policy existed among the governing parties’ (p. 239). Potrafke (2009a) examined
whether government ideology was correlated with budget composition over the 1951-2003
period. The results do not show that government ideology was correlated with growth in
military expenditure (as measured in percent of GDP).
An issue is whether the correlation between growth in military expenditure and
government ideology depends on the time period examined and the empirical strategies employed. We use data over the period 1950-2011 and various government ideology measures to
reexamine the nexus between growth in military expenditure and government ideology.
Examining German military expenditure in a single-country study is a worthwhile
endeavour because Germany initiated the Second World War, and involving German forces in
any military conflict has been a big issue ever since. ‘Germany’s aversion to the use of force
and its embrace of multilateralism is a reaction to the country’s past. As one of Germany’s
eminent scholars on the subject argued, the “first lesson drawn from the Nazi period was a
widespread, instinctive pacifism, a rejection of anything military and of any use of force.”’
(Giegerich 2003, 4). Elaborating on the mission of the North Atlantic Treaty Organization
(NATO) in Afghanistan, Auerswald and Saideman (2014, 22) write: ‘It is impossible to
discuss German behaviour in Afghanistan, for instance, without considering the weight of the
past upon the present day: the pacifism produced by the World War II experience, the reluctance to kill or suffer causalities, and that the German military may have rules and procedures
that are directly derived from these experiences.’ The country’s past influences any kind of
policy-making since 1945 (the European debt crisis is a case in point when protestors in
southern European countries showed images of Adolf Hitler). Military conflict is especially
controversial. To be sure, the country’s past did not prevent any German militarization. By
contrast, during the Cold War, western allies such as the United States supported Germany in
guarding its Eastern border against Soviet aggressions: ‘…the European security interests
with regard to the threat from the East (the thesis being that defence in Central Europe was
4
only possible with the help of West German troops) prevailed…’ (Maneval 1994, 222).
Germany joined the NATO in 1955. Holding off forces in military conflicts notwithstanding,
Germany did not free-ride on NATO burdens (see, for example, Olson and Zeckhauser 1966;
Sandler and Forbes 1980; Solomon 2004; Sandler and Shimizu 2014).
2. Data and Descriptive Statistics
We use data from the German Federal Statistical Office for military expenditure and GDP
from 1950-1990 for former West Germany and from 1991-2011 for reunified Germany. Table
1 shows descriptive statistics and data sources.
Government ideology is measured by different variables: an ideology index
distinguishing between left-wing, center, and right-wing governments, the index of Bjørnskov
(2008a), and ideology indices based on the Comparative Manifesto Project (CMP) of Budge
et al. (2001), Klingemann et al. (2006), and Volkens et al. (2014). We describe the indices of
Bjørnskov (2008a) and the CMP data, and descriptive statistics using these indices below.
The differences between left-wing and right-wing governments will be tested on the
left-right scale using the variable Left and, in an alternative specification, by using different
coalition type dummies. The dummy variable Left takes on the value 1 when a left-wing, 0.5
when a center (grand coalition), and 0 when a right-wing government was in office.
Distinguishing left-wing, center, and right-wing governments by using this variable
corresponds to measuring government ideology as proposed, for example, by Budge et al.
(1993) and Woldendorp et al. (1998, 2000) and employed by Potrafke (2009b). Alternatively,
the coalition type dummy variables take on the value 1 when the considered coalition type
was in power and 0 otherwise. We distinguish between four different coalition types that
governed at the German federal level: CDU/CSU/FDP (right-wing), SPD/FDP (left-wing),
SPD/Greens (left-wing), and CDU/CSU/SPD (center; reference category).
5
Figures 1 and 2 show military expenditure (in percent of GDP) and the growth rate in
military expenditure (in percent of GDP) from 1950/1951 until 2011. The vertically shaded
areas describe the type of government: white is a left-wing government, light grey is a center
government, and dark grey is a right-wing government. The individual coalition parties are
displayed in the top of the bars. In 1950, military expenditure accounted for 4.83% of GDP. In
1967, after the grand coalition of CDU/CSU (Christian Democratic/Social Union) and SPD
(Social Democratic Party) had succeeded the right-wing government of CDU/CSU and FDP
(Free Democratic Party), military expenditure totalled 4.25% of GDP. In autumn 1969, the
left-wing SPD/FDP government was elected to office. Over the 1970-1982 period, military
expenditure hardly changed, edging down from 2.81% to 2.74% of GDP. The right-wing
government in the 1982-1998 period decreased military expenditure to 1.18% of GDP in
1998. In 2005, when the left-wing government of SPD and Greens was replaced by another
grand coalition of CDU/CSU and SPD, military expenditure amounted to 1.03% of GDP.
Columns (1) to (3) in Table 2 show the means of military expenditure (in percent of
GDP) in levels and growth rates under left-wing, center, and right-wing governments.
Military expenditure accounted for 2.21% under left-wing, 2.14% under center, and 3.01% of
GDP under right-wing governments. Variance analysis shows that the differences of the
means in levels are statistically significant at the 10% level. Individual tests show that the
differences between the means between left-wing and right-wing governments are statistically
significant at the 10% level. The growth rate in military expenditure (in percent of GDP) was
about –1.56% under left-wing, –1.16% under center, and –2.30% under right-wing
governments. Differences do not turn out to be statistically significant.
Bjørnskov’s (2008a) index refers to the Henisz (2000) database on political outcomes
since the 19th century, and the general approach to measuring political ideology follows along
the lines of Bjørnskov (2005, 2008b). However, as compared to the index employed in
Bjørnskov (2005, 2008b), the Bjørnskov (2008a) index, ‘takes the social democratic party in a
6
given country as an internationally comparable anchor around which other parties are placed
on a five-point scale (–1; –.5; 0; .5; 1) from left to right’ (Bjørnskov 2008a, 5). The ideology
scores of each government party are weighted with their relative share of all government party
seats in parliament in order to consider differing degrees of influence on government policy.
This procedure addresses the ideological position of the government and the parliament. The
Bjørnskov (2008a) index stresses the potential importance of the domestic political
environment, and particularly whether governments have a majority in parliament or not.
Figure 3 shows that the Bjørnskov (2008a) index is hardly correlated with the growth rate in
military expenditure: the correlation coefficient is –0.04.
The CMP data are based on content analysis of party platforms. The CMP data include
ideological scores of the German parties in the national parliament since 1949. As the scores
are based on manifestos prepared for national elections, they vary by legislative periods and
not by years. The basic CMP score measures parties’ positions on a left-right (L-R) dimension
assuming values between –31 (strongly left-wing) and 50 (strongly right-wing) for German
parties over the period 1949-2011. To measure government ideology based on the CMP data,
we use the L-R scores of the individual parties in government (weighted with each government party’s relative share of all government party seats in parliament). The weighted government ideology measure based on the L-R dimension assumes values between –18.44 (strongly
left-wing) and 50 (strongly right-wing) in our sample. Figure 4 shows that the weighted
government ideology measure based on the L-R dimension is somewhat positively correlated
with the growth rate in military expenditure, indicating that growth in military expenditure
was somewhat higher under right-wing governments (the correlation coefficient is 0.18).
Whitten and Williams (2011, 118) describe: ‘In the extant literature on the influence of
government ideology on military spending, government ideological positions have been
collapsed onto a single left-right scale, based on the assumption that hawkish foreign policies
should occur among more right-wing governments. We propose replacing this with a two7
dimensional conceptualization of government ideology that allows for a full range of combinations of government ideology in terms of welfare and international policies.’ Following
Whitten and Williams (2011), we use the two CMP sub-indices on party positions: support for
international peace and support for welfare (both weighted with each government party’s relative share of all government party seats in parliament). Figures 5 and 6 show that government
ideology measured by support for international peace and support for welfare was hardly correlated with growth in military expenditure (the correlation coefficients are 0.10 and –0.06).
Table 3 shows the correlation coefficients between the individual government
ideology indices. The baseline government ideology variable Left is strongly correlated with
Bjørnskov’s (2008a) ideology variable (r = –0.93), quite correlated with the CMP Left-Right
scale and the CMP Welfare variable (r = –0.49 and 0.58), and hardly correlated with the CMP
International Peace measure (r = –0.10).
3. Empirical Model
The baseline regression model has the following form:
Δln Military expenditure (% of GDP)t = βk Ideologykt + Σl γkl Δln Xlt
+ εk German reunification dummyt + λk + ukt
with k=1,…,5; l=1,…,3; t=1951,…,2011
where the dependent variable Δln Military expenditure (% of GDP)t is the growth rate in
military expenditure (in percent of GDP) in period t. Ideologykt describes the ideological
orientation of the respective government (we use five different ideology measures). Σl Δln Xlt
contains three control variables. We follow the related literature by including the growth rate
in the population (Δln Populationt), the growth rate in GDP per capita (Δln GDP per capitat),
and the growth rate in overall government spending (as percent of GDP; Δln Government
8
spending (% of GDP)t). We include government spending excluding spending for social
affairs, because there is no time series for government spending including spending for social
affairs starting in the 1950s. German reunification dummyt is a dummy variable that takes on
the value 1 in the year 1991 and the value 0 otherwise. This coding implies that a shift in
levels occurred in 1991. 4 We therefore address institutional changes after the fall of the Iron
Curtain. λk is a constant and ukt is an error term. Germany did not have military rivals after the
end of the Second World War, and political institutions did not change. Due to the blame that
it was given for the Second World War, Germany was also not likely to be involved in any
military conflicts and certainly would not dispatch troops (although Germany joined the
NATO in 1955). We therefore do not include other explanatory variables such as military
expenditure by rivals, political institutions or a measure for the likelihood of involvement in a
military conflict that have been proposed by many empirical studies on military expenditure. 5
We estimate an ordinary least squares (OLS) model with standard errors robust to
heteroskedasticity (Huber/White/sandwich standard errors – see Huber 1967 and White 1980).
The Durbin-Watson test for serial correlation in the errors does not imply the existence of
serial correlation. In any event, using the generalized least squares method to estimate the
parameters in a linear regression model in which the error terms are serially correlated does
not change the inferences (Prais-Winsten estimator with robust standard errors).
4. Results
Table 4 shows the regression results. The variable Left and the individual coalition type
dummy variables do not turn out to be statistically significant. The growth rate in government
4
Alternatively, we included a dummy variable that takes on the value 1 in the 1991-2011 period and the value 0
in the 1951-1990 period. The alternative coding implies that a shift in the growth rate after 1990 occurred.
Inferences regarding government ideology do not change.
5
See, for example, Albalate et al. (2012), Bove and Brauner (forthcoming), Bove and Nisticò (2014), Brauner
(forthcoming), Collier and Hoeffler (2007), Dunne et al. (2008), Gadea and Montanes (2001), Nordhaus et al.
(2012), Sandler and Hartley (2007), and Solomon (2005).
9
spending (in percent of GDP) is statistically significant at the 1% level in columns (2) and (4).
The numerical meaning of the effect is that when government spending (in percent of GDP)
increased by 1%, military expenditure (in percent of GDP) increased by about 1.21%. The
elasticity is likely to be larger than one because our measure of government expenditure does
not include spending for social affairs. The coefficients of the growth rates in population and
GDP per capita and the reunification dummy lack statistical significance.
Previous studies on ideology-induced policy making in Germany showed that
government ideology influenced economic policy making in the 1970s and 1980s: left-wing
governments spent more than right-wing governments. Thanks to the decline in electoral
cohesion after the fall of the Iron Curtain, it is also conceivable that ideology-induced policy
making changed after 1990. We therefore include dummy variables for the 1970-1990 period
and the 1991-2011 period and interact the individual dummy variables with the variable Left.
The results in Table 5 show, however, that government ideology had no statistically
significant effect in the 1970-1990 period and the 1991-2011 period.
Table 6 shows that government ideology as measured by Bjørnskov (2008a) does not
turn out to be statistically significant. Previous studies already arrived at the conclusion that
using the measure for government ideology of Bjørnskov (2008a) – and using the measure of
Potrafke (2009b) that resembles the coding of the variable Left – does not change the
inferences regarding ideology-induced policy-making in OECD countries (e.g., Potrafke
2010). 6 More generally, Pickering and Rockey (2011) concluded that alternative ways of
measuring government ideology do not change the inferences regarding ideology-induced
policy-making in OECD countries, even when a government ideology measure based on
manifesto data is included.
6
Other recent empirical studies on partisan politics include Hartmann (2014), Herwartz and Theilen (2014),
Brech and Potrafke (2014), and Wiese (2014).
10
Table 7 shows the results when government ideology is measured by the CMP L-R
scale. The government ideology variable attains statistical significance at the 1% level in
columns (2), (4), and (6), indicating that right-wing governments increased the growth in
military expenditure. The growth in military expenditure increased by about 2.4 percentage
points, when the ideology variable (right-wing) increased by one standard deviation. This
result contrasts with the results shown in Tables 4 to 6. The effect in Table 7, however, is
sensitive to the observations until the early 1960s. The government ideology variable based
on the CMP L-R scores assumes values between –18 (extreme left-wing) and 50 (extreme
right-wing) over the period 1951-2011. Over the periods 1951-1957 and 1963-1969 the
government ideology variable assumes negative values indicating that these conservative
governments were actually quite left-wing. By contrast, over the period 1958-1961 the
government ideology variable based on the CMP L-R scores assumes values between 46 and
50. This drastic change in the government ideology variable in the late 1950s reveals the
shortcomings of the CMP data when the quality of party manifestos is low (see also Gemenis
2013). 7 The party program that was used to code the ideology of the Christian Democratic
Union (CDU) relating to the elections in 1957 was significantly shorter than all other CDU
party platforms: the party program only included 18 sentences compared to 393 sentences on
average over our sample period. The effect shown in Table 7 thus cannot be generalized.
Table 8 shows the results when government ideology is measured by support for
international peace and support for welfare (CMP data). We follow Whitten and Williams
(2011) and include both government ideology variables in one specification. The results do
not show that government ideology as measured by both variables had a significant effect
over the periods 1951-2011 and 1970-1990 (the coefficient estimate of the welfare variable is
statistically significant at the 10% level in column 2 notwithstanding). By contrast, the
7
Criticism of the CMP also encompasses electoral motives: politicians may well design manifestos to become
(re-)elected. It is conceivable that manifestos thus do not describe pure ideology.
11
interaction term between the international peace variable and the dummy variable for the
1991-2011 period is statistically significant at the 1% level in columns (5) and (6). This effect
indicates that growth in military expenditure was lower under governments that supported
international peace over the 1991-2011 period.
Military spending often involves long-run contracts with arms manufacturers. To deal
with lagged effects of government ideology on changes in military spending, we included
government ideology in period t-1, t-2, t-3, t-4, and t-5. When we use the variable Left and the
index of Bjørnskov (2008a), government ideology in period t-1, t-3, t-4, and t-5 lacks
statistical significance. Government ideology in period t-2 attains statistical significance and
indicates that left-wing governments had higher military expenditure (results not shown). The
CMP L-R scale variable in period t-1 and t-2 is positive and statistically significant, indicating
that right-wing governments increased growth in military expenditure. By contrast, the CMP
L-R scale variable in period t-5 is negative and statistically significant, indicating that rightwing governments decreased growth in military expenditure. The CMP International Peace
variable is negative and statistically significant in period t-5. The CMP Welfare variable does
not turn out to be statistically significant in periods t-1 to t-5.
Due to the Second World War, ideology-induced policies were less pronounced in the
1950s and early 1960s – a period in which right-wing governments held office. Citizens were
more concerned with reconstructing the country than with ideology-induced policies. We
therefore also estimated the models for the 1966-2011 period. Inferences do not change when
we use the variable Left, the individual coalition type dummy variables, and the Bjørnskov
(2008a) index. When we use the CMP L-R score variable, the results show that left-wing
governments posted lower growth in military expenditure over the period 1991-2011. When
we use the international peace and welfare variables, the results corroborate the findings
shown in Table 8.
12
5. Conclusion
Why was government ideology not correlated with military expenditure in Germany over the
1951-2011 period? Three explanations spring to mind: firstly, the major parties CDU/CSU,
SPD, and FDP agreed on how to evaluate international risks and threats. The CDU/CSU,
SPD, and FDP shared foreign policy strategies by tying Germany to the NATO and the
European Union. To be sure, the NATO expects military expenditure to amount to 2% of the
member states’ GDP. 8 German military expenditure has not matched the 2%-of-GDP
threshold for many decades. However, no political party endorsed increasing military
expenditure. Secondly, party alignment notwithstanding, politicians were election-motivated
and believed that military expenditure would not win votes. By contrast, left-wing and rightwing governments increased social expenditure, and considered it as more likely to get them
(re-)elected (e.g., Potrafke 2012; Kauder et al. 2014). Government ideology retired to the
background at the federal level. 9 Thirdly, an important reason for why the left-wing
governments in the 1970s advocated military spending (see also Eichenberg and Stoll 2003) is
that the then-chancellor Helmut Schmidt and the minister of defence Georg Leber were both
former soldiers who fought in the Second World War.
A key issue is whether government ideology will influence German military
expenditure in the near future. Thanks to new international risks and threats – Islamist terror
and the conflicts in the East Ukraine are cases in point – German military spending may
increase. 10 Deficiencies in the German army that were covered by the media in autumn 2014
and the German government’s announcement that it seeks to turn the army into an attractive
workplace may also give rise to higher military spending. In fact, the government that is likely
8
See Bove and Cavatorta (2012) on the composition of military expenditure in NATO countries (personnel,
equipment, infrastructure, other).
9
In the German states, government ideology did have an effect: right-wing governments spent more on
universities, introduced tuition fees, hired more cops, and promoted economic freedom (Oberndorfer and Steiner
2007; Kauder and Potrafke 2013; Tepe and Vanhuysse 2013; Potrafke 2013).
10
Smith (2013) predicts that the military industry is likely to become more concentrated when the world gets
more peaceful and military expenditure decreases.
13
to increase military expenditure consists of the conservative CDU/CSU and the socialdemocratic SPD. The consensus between left-wing and right-wing parties in military affairs
and in increasing the size of the government appears to persist.
Acknowledgments
We would like to thank Vincenzo Bove, Georgios Efthyvoulou, Andreas Glas, Todd Sandler,
Vassilis Sarantidis, Jürgen Schnell, Ron Smith, and an anonymous referee for their helpful
comments. We are also grateful to Lisa Giani-Contini for proof-reading the paper. Alexander
H. Schwemmer and Leonard Thielmann provided excellent research assistance.
14
References
Albalate, D., G. Bel, and F. Elias. 2012. “Institutional Determinants of Military Spending.”
Journal of Comparative Economics 40, 279–290.
Alesina, A. 1987. “Macroeconomic Policy in a Two-Party System as a Repeated Game.”
Quarterly Journal of Economics 102, 651–678.
Auerswald, D. P., and S. M. Saideman. 2014. NATO in Afghanistan – Fighting Together,
Fighting Alone. Princeton, NJ: Princeton University Press.
Bayer, S., and L. Naunheim. 2014. “Verteidigungshaushalt und Neuausrichtung der
Bundeswehr – Anpassungsperspektiven und ungelöste Herausforderungen.” In
Streitkräftemanagement, edited by E.-M. Kern and G. Richter, 191–209. Wiesbaden:
Springer.
Bjørnskov, C. 2005. “Does Political Ideology Affect Economic Growth?”
Public Choice 123, 133–146.
Bjørnskov, C. 2008a. “Political Ideology and the Structure of National Accounts in the Nordic
Countries, 1950–2004.” Paper presented at the annual meeting of the European Public
Choice Society, Jena, March 27–30.
Bjørnskov, C. 2008b. “The Growth-Inequality Association: Government Ideology Matters.”
Journal of Development Economics 87, 300–308.
Bove, V., and J. Brauner. Forthcoming. “The Demand for Military Expenditure in
Authoritarian Regimes.” Defence and Peace Economics.
Bove, V., and E. Cavatorta. 2012. “From Conscription to Volunteers: Budget Shares in
NATO Defence Spending.” Defence and Peace Economics 23, 273–288.
Bove, V., G. Efthyvoulou, and A. Navas. 2014. “Political Cycles in Public Expenditure:
Butter vs Guns.” Sheffield Economic Research Paper 2013016.
Bove, V., and R. Nisticò. 2014. “Military in Politics and Budgetary Allocations.” Journal of
Comparative Economics 42, 1065–1078.
Brauner, J. Forthcoming. “Military Spending and Democracy.” Defence and Peace
Economics.
Brech, V., and N. Potrafke. 2014. “Donor Ideology and Types of Foreign Aid.” Journal of
Comparative Economics 42, 61–75.
Budge, I., H. Keman, and J. Woldendorp. 1993. “Political Data 1945–1990. Party
Government in 20 Democracies.” European Journal of Political Research 24, 1–119.
Budge, I., H.-D. Klingemann, A. Volkens, J. Bara, E. Tanenbaum, R. C. Fording, D. J. Hearl,
H. M. Kim, M. McDonald, and S. Mendez. 2001. Mapping Policy Preferences.
15
Estimates for Parties, Electors, and Governments 1945–1998. Oxford: Oxford
University Press.
Collier, P., and A. Hoeffler. 2007. “Unintended Consequences: Does Aid Promote Arms
Races?” Oxford Bulletin of Economics and Statistics 69, 1–28.
Correa H., and J.-W. Kim. 1992. “A Causal Analysis of Defence Expenditures of the USA
and the USSR.” Journal of Peace Research 29, 161–174.
Dalen, H. P., and O. H. Swank. 1996. “Government Spending Cycles: Ideological or
Opportunistic?” Public Choice 89, 183–200.
Dunne, J. P., S. Perlo-Freeman, and R. P. Smith. 2008. “The Demand for Military
Expenditure in Developing Countries: Hostility versus Capability.” Defence and
Peace Economics 19, 293–302.
Eichenberg, R. C., and R. Stoll. 2003. “Representing Defense: Democratic Control of the
Defense Budget in the United States and Western Europe.” Journal of Conflict
Resolution 47, 399–422.
Gadea, M. D., and A. Montanes. 2001. “An Analysis of Defence Spending in Spain: A LongRun Approach.” Defence and Peace Economics 12, 369–393.
Gemenis, K. 2013. “What to Do (and not to Do) with the Comparative Manifestos Project
Data.” Political Studies 61, 3–23.
Giegerich, B. 2003. “Mugged by Reality? German Defense in Light of the 2003 Policy
Guidelines.” DIAS-Kommentare 10, Düsseldorf.
Griffin, L. J., M. Wallace, and J. Devine. 1982. “The Political Economy of Military Spending:
Evidence from the United States.” Cambridge Journal of Economics 6, 1–14.
Hartmann, S. 2014. Partisan Policy-Making in Western Europe – How Ideology Influences
the Content of Government Policies. Wiesbaden: Springer VS.
Henisz, W. 2000. “The Institutional Environment for Growth.”
Economics and Politics 12, 1–31.
Herwartz, H., and B. Theilen. 2014. “Partisan Influence on Social Spending under Market
Integration, Fiscal Pressure and Institutional Change.” European Journal of Political
Economy 34, 409-424.
Hibbs, D. A. Jr. 1977. “Political Parties and Macroeconomic Policy.” American Political
Science Review 71, 1467–1487.
Huber, P. J. 1967. “The Behavior of Maximum Likelihood Estimates under Nonstandard
Conditions.” Proceedings of the Fifth Berkeley Symposium on Mathematical Statistics
and Probability, 221–233.
16
Karagol, E. T., and A. Turhan. 2008. “External Debt, Defence Expenditure and Political
Business Cycles in Turkey.” Defence and Peace Economics 19, 217–224.
Kauder, B., B. Larin, and N. Potrafke. 2014. “Was bringt uns die große Koalition?
Perspektiven der Wirtschaftspolitik.” Perspektiven der Wirtschaftspolitik 15, 88–101.
Kauder, B., and N. Potrafke. 2013. “Government Ideology and Tuition Fee Policy: Evidence
from the German States.” CESifo Economic Studies 59, 628–649.
Klingemann, H.-D., A. Volkens, J. Bara, I. Budge, and M. McDonald. 2006. Mapping Policy
Preferences II. Estimates for Parties, Electors, and Governments in Eastern Europe,
the European Union and OECD 1990–2003. Oxford: Oxford University Press.
Kollias, C., and S. M. Paleologou. 2003. “Domestic Political and External Security
Determinants of the Demand for Greek Military Expenditure.” Defence and Peace
Economics 14, 437–445.
Maneval, H. 1994. “Defence Spending in West Germany.” Defence and Peace Economics 5,
221–246.
Nikolaidou, E. 2008. “The Demand for Military Expenditure: Evidence from the EU15
(1961–2005).” Defence and Peace Economics 19, 273–292.
Nincic, M., and T. R. Cusack. 1979. “The Political Economy of US Military Spending.”
Journal of Peace Research 16, 101–115.
Nordhaus, W., J. R. Oneal, and B. R. Russett. 2012. “The Effects of the International Security
Environment on National Military Expenditures: A Multi-Country Study.”
International Organization 66, 491–515.
Oberndorfer, U., and V. Steiner. 2007. “Generationen- oder Parteienkonflikt? Eine empirische
Analyse der deutschen Hochschulausgaben.” Perspektiven der Wirtschaftspolitik 8,
165–183.
Olson, M., and R. Zeckhauser. 1966. “An Economic Theory of Alliances.” Review of
Economics and Statistics 48, 266–279.
Pickering, A. C., and J. Rockey. 2011. “Ideology and the Growth of Government.”
Review of Economics and Statistics 93, 907–919.
Potrafke, N. 2009a. Konvergenz in der deutschen Finanz- und Sozialpolitik?
Hamburg/Münster: LIT.
Potrafke, N. 2009b. “Did Globalization Restrict Partisan Politics? An Empirical Evaluation of
Social Expenditures in a Panel of OECD Countries.” Public Choice 140, 105–124.
Potrafke, N. 2010. “Does Government Ideology Influence Deregulation of Product Markets?
Empirical Evidence from OECD Countries.” Public Choice 143, 135–155.
17
Potrafke, N. 2011. “Does Government Ideology Influence Budget Composition? Empirical
Evidence from OECD Countries.” Economics of Governance 12, 101–134.
Potrafke, N. 2012. “Is German Domestic Social Policy Politically Controversial?” Public
Choice 153, 393–418.
Potrafke, N. 2013. “Economic Freedom and Government Ideology across the German States.”
Regional Studies 47, 433–449.
Sandler, T., and K. Hartley, eds. 2007. Handbook of Defence Economics Vol. 2. Amsterdam:
North-Holland.
Sandler, T., and J. F. Forbes. 1980. “Burden Sharing, Strategy, and the Design of the NATO.”
Economic Inquiry 18, 425–444.
Sandler, T., and H. Shimizu. 2014. “NATO Burden Sharing 1999–2010: An Altered
Alliance.” Foreign Policy Analysis 10, 43–60.
Scheffé, H. 1953. “A Method for Judging all Contrasts in the Analysis of Variance.”
Biometrika 40, 87–110.
Smith, R. 2013. “The Defense Industry in an Age of Austerity.” Economics of Peace and
Security Journal 8, 18–22.
Solomon, B. 2004. “NATO Burden Sharing Revisited.” Defence and Peace Economics 15,
251–258.
Solomon, B. 2005. “The Demand for Canadian Defence Expenditures.” Defence and Peace
Economics 16, 171–189.
Strauss, A. 2015. “Government ideology and arms exports.” Paper presented at the annual
meeting of the European Public Choice Society, Groningen, April 7–10.
Tepe, M., and P. Vanhuysse. 2013. “Cops for Hire? The Political Economy of Police
Employment in the German States.” Journal of Public Policy 33, 165–199.
Tridimas, G. 2015. “War, Disenfranchisement and the Fall of the Ancient Athenian
Democracy.” European Journal of Political Economy 38, 102–117.
Volkens, A., P. Lehmann, N. Merz, S. Regel, A. Werner, and H. Schultze. 2014. The
Manifesto Data Collection. Manifesto Project (MRG/CMP/MARPOR). Version 2014b.
Berlin: Wissenschaftszentrum Berlin für Sozialforschung (WZB).
White, H. 1980. “A Heteroskedasticity-Consistent Covariance Matrix Estimator and a Direct
Test for Heteroskedasticity.” Econometrica 48, 817–838.
Whitten, G. D., and L. K. Williams. 2011. “Buttery Guns and Welfare Hawks: The Politics of
Defense Spending in Advanced Industrial Democracies.” American Journal of
Political Science 55, 117–134.
18
Wiese, R. 2014. “What Triggers Reforms in OECD Countries? Improved Reform
Measurement and Evidence from the Healthcare Sector.” European Journal of
Political Economy 34, 332–352.
Wlezien, C. 1996. “Dynamics of Representation: The Case of US Spending on Defense.”
British Journal of Political Science 26, 81–103.
Woldendorp, J., H. Keman, and I. Budge. 1998. “Party Government in 20 Democracies: An
Update 1990–1995.” European Journal of Political Research 33, 125–164.
Woldendorp, J., H. Keman, and I. Budge. 2000. Party Government in 48 Democracies 1945–
1998: Composition, Duration, Personnel. Dordrecht: Kluwer Academic Publishers.
19
7
Figure 1: Military expenditure (in percent of GDP), 1950-2011
CDU/CSU CDU/CSU CDU/CSU
FDP
SPD
SPD
FDP
CDU/CSU
FDP
SPD
Greens
CDU/CSUCDU/CSU
SPD
FDP
0
Military expenditure (in percent of GDP)
1
2
3
4
5
6
CDU/CSU
FDP
1950
1955
1960
1965
1970
1975
1980
Year
1985
1990
1995
2000
2005
2010
Source: Federal Statistical Office, own illustration.
Growth rate in military expenditure (in percent of GDP)
20
30
40
-30 -20 -10
0
10
Figure 2: Growth rate in military expenditure (in percent of GDP), 1951-2011
CDU/CSU
FDP
1950
1955
CDU/CSU CDU/CSU CDU/CSU
FDP
SPD
1960
1965
1970
SPD
FDP
1975
CDU/CSU
FDP
1980
Year
1985
1990
SPD
Greens
1995
2000
CDU/CSUCDU/CSU
SPD
FDP
2005
2010
Source: Federal Statistical Office, own illustration.
20
Growth rate in military expenditure (in percent of GDP)
0
20
40
-40
-20
Figure 3: Correlation between the growth rate in military expenditure (in percent of GDP) and
government ideology as measured by Bjørnskov (2008a), 1951-2011.
Correlation coefficient: –0.04
-.2
.4
0
.2
Government ideology (right-wing) - Bjørnskov
.6
Source: Federal Statistical Office, Bjørnskov (2008a), and own calculations.
21
Growth rate in military expenditure (in percent of GDP)
0
20
40
-40
-20
Figure 4: Correlation between the growth rate in military expenditure (in percent of GDP) and
government ideology as measured by the CMP Left-Right scale, 1951-2011.
Correlation coefficient: 0.18
-20
0
20
40
Government ideology (right-wing) - CMP
60
Source: Federal Statistical Office, Budge et al. (2001), Klingemann et al. (2006), Volkens et al. (2014), and own
calculations.
22
Growth rate in military expenditure (in percent of GDP)
0
20
40
-40
-20
Figure 5: Correlation between the growth rate in military expenditure (in percent of GDP) and
government ideology as measured by Support for International Peace (CMP data), 1951-2011.
Correlation coefficient: 0.10
0
2
4
Government ideology - CMP international peace
6
Source: Federal Statistical Office, Budge et al. (2001), Klingemann et al. (2006), Volkens et al. (2014), and own
calculations.
23
Growth rate in military expenditure (in percent of GDP)
0
20
40
-40
-20
Figure 6: Correlation between the growth rate in military expenditure (in percent of GDP) and
government ideology as measured by Support for Welfare (CMP data), 1951-2011.
Correlation coefficient: –0.06
0
5
10
15
Government ideology - CMP welfare
20
Source: Federal Statistical Office, Budge et al. (2001), Klingemann et al. (2006), Volkens et al. (2014), and own
calculations.
24
Table 1: Descriptive statistics and data sources
Variable
Obs.
Mean
Std. Dev.
Min
Max Source
Military expenditure (% of GDP)
Left-wing government
CDU/CSU/FDP
SPD/FDP
SPD/Greens
CDU/CSU/SPD
Ideology – Bjørnskov (right-wing)
Ideology – CMP Left-Right scale
(right-wing)
Ideology – CMP International Peace
62
62
62
62
62
62
62
62
2.65
0.38
0.56
0.21
0.11
0.11
0.39
4.42
1.32
0.46
0.50
0.41
0.32
0.32
0.24
17.69
0.98
0
0
0
0
0
-0.09
-18.44
6.63
1
1
1
1
1
0.64
50
62
2.76
1.85
0.13
6.44
Ideology – CMP Welfare
62
11.02
4.26
3.08
17.77
Population (in 1000)
GDP per capita (in 1000)
Government spending (% of GDP)
Reunification dummy
62 66632.73 11406.64 50958 82537
62
14.08
10.28
0.98 33.60
62
28.21
2.88
21.33 31.54
62
0.02
0.13
0
1
Federal Statistical Office
Own calculation
Own calculation
Own calculation
Own calculation
Own calculation
Bjørnskov (2008a)
Budge et al. (2001), Klingemann et al.
(2006), Volkens et al. (2014)
Budge et al. (2001), Klingemann et al.
(2006), Volkens et al. (2014)
Budge et al. (2001), Klingemann et al.
(2006), Volkens et al. (2014)
Federal Statistical Office
Federal Statistical Office
Federal Statistical Office
Own calculation
Table 2: Military expenditure (in percent of GDP) and growth rate in military expenditure (in
percent of GDP) under individual types of governments
Variance
analysis
Means
Individual tests
(4)
Left –
Center
(5)
Right –
Center
(6)
Left –
Right
(7)
3.01
3.11*
(0.05)
0.08
(0.99)
-0.87
(0.27)
-0.80*
(0.09)
-2.30
0.04
(0.96)
-0.40
(1.00)
1.14
(0.97)
0.74
(0.97)
Left
Center
Right
F-Test
(1)
(2)
(3)
Military expenditure
(% of GDP) 1950-2011
2.21
2.14
Growth rate in
military expenditure
(% of GDP) 1951-2011
-1.56
-1.16
Notes: * implies to reject the null hypothesis at the 10% significance level. Column (4) shows F-statistics and pvalues in brackets. Columns (5) to (7) show the individual differences of the means and p-values in brackets. The
p-values in columns (5) to (7) refer to the test of Scheffé (1953).
25
Table 3: Correlation matrix of ideology indices (1951-2011 period)
Left-wing
government
Ideology –
Bjørnskov
(right-wing)
Ideology –
CMP LeftRight scale
(right-wing)
Ideology –
CMP
International
Peace
Left-wing government
1.00
Ideology – Bjørnskov
(right-wing)
-0.93
1.00
Ideology – CMP
Left-Right scale
(right-wing)
Ideology – CMP
International Peace
-0.49
0.43
1.00
-0.10
0.05
0.09
1.00
Ideology – CMP
Welfare
0.58
-0.56
-0.79
0.23
Ideology –
CMP Welfare
1.00
26
Table 4: Regression results. OLS estimator with robust standard errors.
Dependent variable: growth rate in military expenditure (in percent of GDP) in the 1951-2011
period
Left
CDU/CSU/FDP
SPD/FDP
SPD/Greens
∆ln Population
(1)
0.787
(0.29)
(2)
-0.627
(0.36)
(3)
(4)
-1.141
(0.25)
-0.217
(0.05)
-0.749
(0.19)
-0.234
(0.07)
-2.944
(0.82)
2.705
(0.93)
-2.509
(1.27)
0.574
(1.09)
1.231***
(7.47)
55.33
(1.02)
-3.611
(1.24)
61
0.546
-2.064
(1.13)
∆ln GDP per capita
0.390
(0.87)
∆ln Government spending (% of GDP)
1.196***
(7.30)
Reunification dummy
42.01
(0.85)
Constant
-2.231
-2.848
-1.160
(0.95)
(1.26)
(0.31)
Observations
61
61
61
R-squared
0.001
0.531
0.002
Notes: Absolute values of t-statistics in brackets; ***: significant at the 1% level.
27
Table 5: Regression results. OLS estimator with robust standard errors.
Leftist government.
Interaction with 1970-1990 decadal dummy and 1991-2011 decadal dummy.
Dependent variable: growth rate in military expenditure (in percent of GDP) in the 1951-2011
period
Left
Dummy 1970-1990
Left * Dummy 1970-1990
Dummy 1991-2011
Left * Dummy 1991-2011
∆ln Population
(1)
0.449
(0.11)
-0.853
(0.27)
1.061
(0.25)
(2)
3.388
(0.94)
1.013
(0.41)
-5.485
(1.10)
(3)
-1.043
(0.28)
(4)
-1.603
(0.61)
-4.852
(1.34)
6.098
(1.44)
-0.0627
(0.02)
5.439
(1.32)
-0.424**
(2.55)
0.477
(0.89)
1.206***
(7.30)
-4.391
(1.04)
61
0.539
-0.422**
(2.26)
∆ln GDP per capita
0.462
(0.96)
∆ln Government spending (% of GDP)
1.207***
(7.56)
Constant
-2.034
-4.625
-0.756
(0.66)
(1.28)
(0.23)
Observations
61
61
61
R-squared
0.002
0.535
0.025
Notes: Absolute values of t-statistics in brackets; **/***: significant at the 5/1% level.
28
Table 6: Regression results. OLS estimator with robust standard errors.
Government ideology as measured by Bjørnskov (2008a).
Dependent variable: growth rate in military expenditure (in percent of GDP) in the 1951-2011
period
Ideology – Bjørnskov (right-wing)
Dummy 1970-1990
Ideology – Bjørnskov (right-wing) *
Dummy 1970-1990
Dummy 1991-2011
Ideology – Bjørnskov (right-wing) *
Dummy 1991-2011
∆ln Population
(1)
-1.724
(0.35)
(2)
-1.276
(0.36)
(3)
-1.357
(0.23)
0.348
(0.12)
-1.755
(0.24)
(4)
-6.682
(1.32)
-5.870
(1.52)
12.45
(1.45)
-1.757
-0.419**
(0.98)
(2.54)
∆ln GDP per capita
0.391
0.466
(0.86)
(1.04)
∆ln Government spending (% of GDP)
1.196***
1.216***
(7.25)
(7.80)
Reunification dummy
34.68
(0.71)
Constant
-1.254
-2.717
-1.328
-0.867
(0.90)
(1.05)
(0.69)
(0.46)
Observations
61
61
61
61
R-squared
0.001
0.531
0.002
0.540
Notes: Absolute values of t-statistics in brackets; **/***: significant at the 5/1% level.
(5)
1.168
(0.12)
(6)
1.689
(0.22)
-0.0539
(0.02)
-6.040
(0.59)
4.715
(1.00)
-6.861
(0.77)
-0.435***
(2.85)
0.470
(0.86)
1.211***
(7.11)
-1.607
(0.54)
61
0.016
-5.601
(1.06)
61
0.535
29
Table 7: Regression results. OLS estimator with robust standard errors.
Government ideology as measured by the CMP Left-Right scale.
Dependent variable: growth rate in military expenditure (in percent of GDP) in the 1951-2011
period
Ideology – CMP (right-wing)
Dummy 1970-1990
Ideology – CMP (right-wing) *
Dummy 1970-1990
Dummy 1991-2011
Ideology – CMP (right-wing) *
Dummy 1991-2011
∆ln Population
(1)
0.112
(0.93)
(2)
0.138***
(3.65)
(3)
0.189
(1.05)
1.379
(0.58)
-0.216
(1.17)
(4)
0.164***
(2.69)
0.333
(0.15)
-0.107
(1.16)
(5)
0.106
(0.67)
(6)
0.112***
(2.95)
-3.660
(1.52)
0.0885
(0.49)
0.958
(0.27)
0.0677
(0.61)
-0.371**
(2.08)
0.483
(0.89)
1.215***
(7.50)
-2.367
-0.401***
(1.26)
(3.07)
∆ln GDP per capita
0.501
0.354
(1.13)
(0.80)
∆ln Government spending (% of GDP)
1.216***
1.185***
(8.49)
(7.50)
Reunification dummy
52.85
(1.04)
Constant
-2.437*
-4.323*
-3.367
-4.417*
-1.406
(1.80)
(1.90)
(1.53)
(1.92)
(0.70)
Observations
61
61
61
61
61
R-squared
0.031
0.575
0.057
0.570
0.050
Notes: Absolute values of t-statistics in brackets; */**/***: significant at the 10/5/1% level.
-5.340
(1.28)
61
0.568
30
Table 8: Regression results. OLS estimator with robust standard errors.
Government ideology as measured by Support for International Peace and Support for
Welfare (CMP data).
Dependent variable: growth rate in military expenditure (in percent of GDP) in the 1951-2011
period
Ideology – CMP International Peace
Ideology – CMP Welfare
Dummy 1970-1990
Ideology – CMP International Peace *
Dummy 1970-1990
Ideology – CMP Welfare *
Dummy 1970-1990
Dummy 1991-2011
Ideology – CMP International Peace *
Dummy 1991-2011
Ideology – CMP Welfare *
Dummy 1991-2011
∆ln Population
(1)
0.703
(0.77)
-0.232
(0.60)
(2)
0.337
(0.76)
-0.411*
(1.75)
(3)
1.049
(0.59)
-0.413
(0.76)
-4.808
(0.70)
-0.660
(0.36)
0.537
(0.85)
(4)
0.0310
(0.03)
-0.395
(1.41)
-1.332
(0.22)
0.448
(0.36)
0.0260
(0.07)
(5)
0.921
(0.63)
-0.236
(0.27)
(6)
1.373
(1.30)
-0.100
(0.19)
-0.161
9.458
(0.01)
(0.79)
-6.055*** -7.432***
(3.23)
(3.59)
0.718
0.574
(0.80)
(0.93)
-0.443*
-0.0604
(1.98)
(0.31)
0.400
0.635
(0.77)
(1.15)
1.202***
1.254***
(7.22)
(8.12)
-2.296
(1.22)
∆ln GDP per capita
0.471
(0.97)
∆ln Government spending (% of GDP)
1.210***
(8.13)
Reunification dummy
49.12
(0.97)
Constant
-1.306
0.111
-0.367
0.298
(0.33)
(0.05)
(0.09)
(0.10)
Observations
61
61
61
61
R-squared
0.016
0.552
0.025
0.544
Notes: Absolute values of t-statistics in brackets; */***: significant at the 10/1% level.
-1.536
(0.10)
61
0.071
-10.19
(0.83)
61
0.603
31


© Copyright 2025