
Document 141088
Behavioral Health is Essential To Health • Prevention Works • Treatment is Effective • People Recover Behavioral Health Treatment Needs Assessment Toolkit for States ACKNOWLEDGMENTS This report was prepared for the Substance Abuse and Mental Health Services Administration (SAMHSA) by Truven Health Analytics Inc, formerly the Healthcare business of Thomson Reuters, under SAMHSA IDIQ Prime Contract #HHSS283200700029I, Task Order #HHSS283200700029I/HHSS28342002T with SAMHSA, U.S. Department of Health and Human Services (HHS). Kevin Malone served as the Contracting Officer Representative. PUBLIC DOMAIN NOTICE All material appearing in this report is in the public domain and may be reproduced or copied without permission from SAMHSA. Citation of the source is appreciated. However, this publication may not be reproduced or distributed for a fee without the specific, written authorization of the Office of Communications, SAMHSA, HHS. ELECTRONIC ACCESS AND COPIES OF PUBLICATION This publication may be downloaded at http://store.samhsa.gov. Or, call SAMHSA at 1-877-SAMHSA-7 (1-877-726-4727) (English and Español). RECOMMENDED CITATION Substance Abuse and Mental Health Services Administration. Behavioral Health Treatment Needs Assessment Toolkit for States. HHS Publication No. SMA13-4757. Rockville, MD: Substance Abuse and Mental Health Services Administration, 2013. ORIGINATING OFFICES Office of Policy, Planning, and Innovation, Substance Abuse and Mental Health Services Administration, 1 Choke Cherry Road, Rockville, MD 20857. HHS Publication No. SMA13-4757 Printed in 2013 TABLE OF CONTENTS I. Overview .................................................................................................................................................. 5 II. Why Assess the Need for Behavioral Health Services?............................................................................ 6 III. Case Studies on the Use of Behavioral Health Needs Assessments ........................................................ 7 Wisconsin Case Study: Possible Implications of Not Conducting a Needs Assessment ......................... 7 Maryland Case Study: Using Data to Inform Planning ............................................................................. 8 Washington State Case Study: Using Data to Inform Planning................................................................ 8 IV. Existing Behavioral Health Conditions: Prevalence and Utilization Estimates ........................................ 9 Behavioral Health Conditions Prevalence Estimates ............................................................................... 9 Behavioral Health Utilization Estimates ................................................................................................ 17 V. Methods for Estimating Behavioral Health Service Need and Use........................................................ 33 National Survey of Drug Use and Health Data as a Resource for System Planning............................... 33 Instructions for Using the NSDUH (R-DAS) to Estimate Behavioral Health Prevalence and Service Use………….. ............................................................................................................................................ 35 Instructions for Using the NSDUH Data Portal to Estimate Behavioral Health Prevalence and Service Use………….. ............................................................................................................................................ 37 Instructions for Using the American Community Survey to Estimate the Number of People Who Will Enroll in Insurance Expansions .............................................................................................................. 38 Key Considerations ................................................................................................................................ 40 VI. Methods for Estimating County-Level Behavioral Health Service Need and Use.................................. 42 VII. Conclusion .............................................................................................................................................. 43 3 LIST OF TABLES Table 1: Prevalence of Behavioral Health Conditions in Past Year Among Adults Aged 18–64 Years ....... 10 Table 2: Prevalence of Behavioral Health Conditions in Past Year Among Adults Aged 18–64 Years with Current Medicaid Coverage, by State ......................................................................................................... 11 Table 3: Prevalence of Behavioral Health Conditions in Past Year Among Adults Aged 18–64 Years Who Are Uninsured and Have Annual Family Incomes < 139 Percent of Federal Poverty Level, by State ........ 13 Table 4: Prevalence of Behavioral Health Conditions in Past Year Among Adults Aged 18–64 Years Who Are Uninsured and Have Annual Family Incomes Between 133 and 399 Percent of Federal Poverty Level, by State ....................................................................................................................................................... 15 Table 5: Receipt of Mental Health and Substance Use Treatment in Past Year Among Adults Aged 18–64 Years............................................................................................................................................................ 18 Table 6: Receipt of Mental Health and Substance Use Treatment in Past Year Among Adults Aged 18–64 Years with Medicaid Coverage, by State .................................................................................................... 19 Table 7: Receipt of Mental Health and Substance Use Treatment in Past Year Among Adults Aged 18–64 Years Who Are Uninsured and Have Annual Family Incomes < 139 Percent of Federal Poverty Level, by State ............................................................................................................................................................ 22 Table 8: Receipt of Mental Health and Substance Use Treatment in Past Year Among Adults Aged 18–64 Years Who are Uninsured and Have Annual Family Incomes Between 133 and 399 Percent of Federal Poverty Level, by State................................................................................................................................ 25 Table 9: Adults Aged 18–64 Years Who Have Annual Family Incomes < 139 Percent of Federal Poverty Level, by Insurance Status, Nationally and by State ................................................................................... 29 Table 10: Adults Aged 18–64 Years Who Have Annual Family Incomes Between 133 and 399 Percent of Federal Poverty Level, by Insurance Status, Nationally and by State ......................................................... 31 4 I. Overview The Behavioral Health Treatment Needs Assessment Toolkit is intended to provide states and other payers with information on the prevalence and use of behavioral health services; step-by-step instructions to generate projections of utilization under insurance expansions; and factors to consider when deciding the appropriate mix of behavioral health benefits, services, and providers to meet the needs of newly eligible populations. The Toolkit was developed by the Substance Abuse and Mental Health Services Administration (SAMHSA). The Toolkit provides guidance on key questions that states and other payers may need to answer regarding behavioral health treatment needs and service use. It also summarizes how several states have approached planning for newly eligible populations. The Toolkit provides estimates of the prevalence of behavioral health disorders and use of behavioral health services among populations who are currently uninsured and may become eligible for insurance. Finally, the Toolkit includes a section that describes how users can access and analyze other data on behavioral health needs by particular subpopulations within states, income groups, insurance status groups, and age groups. Consistent with the use of data required in SAMHSA’s Block Grant applications,1 and in conjunction with the Department of Health and Human Services (HHS) National Quality Strategy2 and the National Behavioral Health Quality Framework (NBHQF),3 this Toolkit describes how state mental health and substance abuse authorities can use data to plan for the quality of health and behavioral health care nationally and within states, communities, territories, and tribes. There are three broad aims on which states are asked to focus to improve the quality of health and behavioral health care nationally: Better Care: Improve the overall quality, by making behavioral health care more person-, family-, and community-centered, reliable, accessible, and safe. Healthy People/Healthy Communities: Improve the behavioral health of the U.S. population by supporting proven interventions to address behavioral, social, cultural, and environmental determinants of positive behavioral health in addition to delivering higher quality behavioral health care. Affordable Care: Increase the value of behavioral health care for individuals, families, employers, and governments. The Toolkit highlights ways in which planning efforts can leverage the National Survey on Drug Use and Health (NSDUH), sponsored by SAMHSA in the U.S. Department of Health and Human Services. The survey is the primary source of information on the use of illicit drugs, alcohol, and tobacco in the civilian, noninstitutionalized population of the United States aged 12 years or older. In recent years, it has also included information on mental health conditions and use of mental health and substance abuse services. The NSDUH can be used to develop national- and state-level estimates, overall and by particular subpopulations affected by new program and insurance expansions. 1 FY 2014-2015 Block Grant Application; Community Mental Health Services Plan and Report; Substance Abuse Prevention and Treatment Plan and Report. Available at: http://www.samhsa.gov/grants/blockgrant/docs/BGapplication-100312.pdf. 2 National Strategy for Quality Improvement in Healthcare. Available at: http://www.ahrq.gov/workingforquality/. 3 National Behavioral Health Quality Strategy. Available at: http://www.ahrq.gov/workingforquality/nqs/nqsplans5.htm#samsha. 5 Section II of this report provides a background of the need for quantitative tools and data in assessing behavioral health needs among populations eligible for new coverage opportunities. Section II also provides examples of the types of questions that a state policymaker or payer could answer with needs assessment data. Section III provides a series of brief case studies from Wisconsin, Maryland, and Washington describing how those states have utilized similar data and processes for assessing behavioral health needs among populations eligible for new coverage programs. Section IV provides state-level estimates of the prevalence of behavioral health conditions—serious mental illness (SMI), serious psychological distress (SPD), substance use disorders (SUD) and use of behavioral health services—among specific populations within states. Specifically, data are provided for adults aged 18 to 64 years overall. These adults currently are covered by Medicaid and currently are uninsured and have income levels that would make them eligible for the Medicaid expansion or Affordable Insurance Exchanges. Section V includes step-by-step instructions on how to develop state-level estimates of the prevalence of behavioral health conditions and current use of behavioral health services for particular populations using the NSDUH via an online tool or by obtaining the dataset. Also discussed are factors that need to be considered in generating estimates, such as how gaining insurance may influence utilization rates and assumptions about participation rates. This section also provides national and state population estimates from the American Community Survey, which are widely used to create state- and countylevel population estimates by insurance and income. Finally, Section VI describes how data can be utilized to create county-level estimates of the prevalence of behavioral health conditions and use of treatment services. II. Why Assess the Need for Behavioral Health Services? There is a significant need for quantitative tools and data on which to base mental health and substance abuse system planning.4 This is particularly true now, as the Affordable Care Act provides insurance coverage for millions of currently uninsured Americans and stimulates a myriad of new delivery system re-designs.5 Many of those who will be newly insured and affected by these innovations have low incomes and may have significant unmet needs for mental health and substance abuse treatment.6 Key decisions regarding the appropriate mix of services, the adequacy of existing provider networks and workforce, licensing, quality measurement, contracting, etc., must be informed by data to avoid unintended problems with access, costs, and ultimately population health. For example, data can be used to help: Plan for targeted use of funds from state general revenue, the federal substance abuse prevention and treatment block grant, and federal mental health block grant; 4 Leff HS, Hughes DR, Chow CM, Noyes S, Ostrow L. A Mental Health Allocation and Planning Simulation Model: A Mental Health Planner’s Perspective. In: Handbook of Healthcare Delivery Systems. July 2009. http://www.hsri.org/files/Mental%20Health%20Allocation%20and%20Planning%20Simulation%20Model-Final-PDFversion.pdf. 5 Elmendorf DW. Congressional Budget Office: Letter to the Honorable Nancy Pelosi. March 20, 2010. Available at: http://www.cbo.gov/ftpdocs/113xx/doc11379/AmendReconProp.pdf. 6 McAlpine DD, Mechanic D. 2000. Utilization of Specialty Mental Health Care Among Persons with Severe Mental Illness: The Roles of Demographics, Need, Insurance, and Risk. Health Services Research: 35(1):277–292. Available at: http://www.ncbi.nlm.nih.gov/pmc/articles/PMC1089101/pdf/hsresearch00009-0110.pdf. 6 III. Plan for service needs of newly eligible individuals; Plan for development of adequate and sufficient networks of providers in qualified health plans; Plan for Medicaid Benchmark plan7; Plan for outreach and enrollment assistance; Assist the state in evaluating the impact that its outreach, eligibility determination, enrollment, and re-enrollment systems will have on eligible individuals with behavioral health conditions; Identify any additional quality measures to be monitored. Case Studies on the Use of Behavioral Health Needs Assessments a. Wisconsin Case Study: Possible Implications of Not Conducting a Needs Assessment Wisconsin expanded its Medicaid Program under an 1115 Demonstration with the Centers for Medicare & Medicaid Services (CMS) to include single adults at 200 percent or less of the federal poverty level starting in 2009. As part of the agreement, the program—called BadgerCare Plus Core—had to be budget- or cost-neutral with respect to the use of federal payments. As part of the expansion to single adults, a special benefit package of services was developed for eligible individuals. The service package was more limited than that covered in the existing Wisconsin Medicaid programs. For mental health services, the benefit package covered psychotropic medications and outpatient visits, but only if they were provided by a psychiatrist. It did not include psychotherapy or medications provided by other mental health clinicians including social workers, psychologists, or advance practice nurses. No needs assessment was done for this particular service area or population. As the program was implemented, it became apparent that the benefits covered were not adequate to meet the needs of the enrollees. BadgerCare Plus Core psychiatrists and clinics, particularly in the Milwaukee area, became inundated with requests for medication-only appointments. Appropriate treatment, particularly for first time-patients, should include an initial outpatient screening and assessment and often a referral to outpatient counseling and therapy prior to any medication assessment. However, these services—and coverage of the types of non-physician, mental health clinicians who would provide them—were not reimbursable under the BadgerCare Plus Core service package. Although the inadequacy of the benefit package became apparent relatively quickly after the program began, revising the BadgerCare Plus Core benefits and eligible service providers after the program had been initiated was a complex and time-consuming process because it was a 1115 Demonstration. Thus, 7 Medicaid. Benchmark Benefits. Available at: http://www.medicaid.gov/Medicaid-CHIP-Program-Information/By-Topics/Benefits/Benchmark-Benefits.html. 7 this example illustrates the importance of anticipating the need for particular services and provider types prior to a program expansion. b. Maryland Case Study: Using Data to Inform Planning Maryland's experience with a primary care program for low-income adults coupled with thoughtful use of patient claims and authorization data have helped prepare the state for a likely Medicaid expansion. Maryland has access to years of historical claims data that have enabled the state to conduct analyses of costs and utilization by age group, diagnoses, and eligibility criteria over time. The state used the data to generate projections and characteristics of the population that will be newly Medicaid eligible in 2014. This information is important in developing cost estimates for the likely expansion and in preparing to meet the behavioral health needs of the newly eligible population. The data have also informed decisions in the Maryland Legislature. In 2013, Maryland increased payment rates for Medicaid patients to match those of Medicare not only for primary care providers, but for all physicians in an effort to incentivize behavioral health service providers, including psychiatrists. Finally, the data have informed Maryland’s decision to move forward in implementing telemedicine statewide to accommodate the needs of individuals in rural areas. Maryland anticipates that enrollment of newly eligible individuals will be gradual. The state will conduct targeted outreach efforts in jails, prisons, and state hospitals to increase Medicaid enrollment as soon as possible upon release. Maryland is hopeful that continuous data monitoring and provider incentives will equip the state to deliver appropriate behavioral health services to newly covered low-income adults. c. Washington State Case Study: Using Data to Inform Planning Washington has utilized data to help begin to assess and prepare for an expanded Medicaid program in 2014. Washington’s integrated client database—which contains mental health, Temporary Assistance for Needy Families (TANF), chemical dependency, medical and child welfare, corrections, and jail utilization data—has been critical in helping identify individuals at high risk and high need as part of the Medicaid expansion. The data have also been critical in designing Washington’s health homes state plan amendment. Washington is also continuing to utilize data to inform important budgetary decisions to ensure that the state is prepared to provide behavioral health services to the newly eligible population. The current Medicaid managed care medical contracts have outpatient visit limits (12 visits for adults and 20 visits for children); however, to comply with mental health parity, visit limits will be removed for the newly eligible Medicaid population in 2014. Currently, the state is leaning toward eliminating visit limits for currently enrolled Medicaid beneficiaries in order to have aligned benefit packages. The projected enrollment and utilization estimates under expanded Medicaid program have identified an increased need for behavioral health providers, particularly psychiatrists. In addition to provider capacity for the newly eligible population, additional provider demand for the currently eligible Medicaid population is likely. The state is currently working to determine how to better incorporate behavioral health services into primary care; data can help inform allocation of resources at the state and county levels. 8 IV. Existing Behavioral Health Conditions: Prevalence and Utilization Estimates In this section, we provide national- and state-level estimates of the prevalence of mental health and substance use conditions for current adult Medicaid enrollees (ages 18–64 years), as well as for the populations that would be eligible for state Medicaid expansions and health insurance exchanges. We begin by describing the eligibility criteria for the populations that will be covered and how they align with the prevalence estimates. Beginning in 2014, the Affordable Care Act extends Medicaid coverage to all individuals aged 19 through 64 years with incomes up to 133 percent of the federal poverty level (FPL), or $14,856 for an individual and $30,656 for a family of four (based on the 2012 FPL).8 The eligibility for the adult group also includes a 5 percent income disregard, leading to an effective FPL of 138 percent. Children are currently eligible and will remain eligible for either Medicaid or the Children’s Health Insurance Program (CHIP) at higher income levels, based on the eligibility standards already in effect in their state. In the following set of tables, we provide national- and state-level estimates of the prevalence of mental health and substance use conditions for the current adult Medicaid enrollees and currently uninsured adults with incomes that would make them eligible for state Medicaid expansions (i.e., < 139 percent of FPL). Individuals with employer-sponsored insurance and individual insurance may also obtain Medicaid coverage, although the majority of new enrollees are expected to be currently uninsured. The focus of the estimates provided here is on this population. In addition to extending Medicaid coverage, the Affordable Care Act will provide subsidies for low- and medium-income people (between 100 percent and 400 percent of FPL) to buy health insurance as well as penalties for individuals who fail to obtain health insurance. The Affordable Care Act will also launch the creation of state health insurance exchanges to provide access to information for potential consumers and to a range of health insurance plans. The Affordable Insurance Exchanges are targeted to those who are not enrolled in Medicaid, Medicare, or affordable employer-based plans. As with the analysis of the Medicaid expansion population, in the following tables we focus on adults aged 18 to 64 years who are currently uninsured and have incomes that would make them eligible for the subsidies (i.e., incomes between 133 and 399 percent of FPL).9 Behavioral Health Conditions Prevalence Estimates Table 1 presents national prevalence estimates of serious mental illness (SMI), serious psychological distress (SPD), and substance use disorder (SUD) among adults aged 18 to 64 years who are either currently enrolled in Medicaid, who are uninsured and have incomes less than 139 percent of FPL, or who are uninsured and have incomes between 133 percent and 399 percent of FPL.10 The estimates are based on the pooled 2008–2011 National Survey on Drug Use and Health (NSDUH). 8 Centers for Medicare and Medicaid Services. Assuring Access to Affordable Coverage: Medicaid and the Children’s Health Insurance Program Final Rule. Available at http://www.medicaid.gov/AffordableCareAct/Provisions/Downloads/MedicaidCHIPEligibility-Final-Rule-Fact-Sheet-Final-3-16-12.pdf. 9 We focus on the range of 133–399 because of the assumption that those with < 133 percent of FPL would enroll in Medicaid. 10 See Section V for more detailed definitions of measures. 9 Tables 2–4 present the same estimates by state. Table 2 presents the prevalence of SMI, SPD, and SUD for current Medicaid enrollees aged 18 to 64 years by state. Table 3 present similar data for adults aged 18 to 64 years who are uninsured and have incomes less than 139 percent of FPL by state. Table 4 displays prevalence percentages for adults aged 18 to 64 years who are uninsured and have incomes between 133 percent and 399 percent of FPL by state. The estimates reveal that among those who are uninsured and have incomes less than 139 percent of FPL, nationally, 7.1 percent have a serious mental illness, 14.9 percent have serious psychological distress, and 13.6 percent have a substance use disorder. Among those who are uninsured and have incomes between 133 and 399 percent, 6.1 percent have a serious mental illness, 13.5 percent have serious psychological distress, and 14.3 percent have a substance use disorder. There is variation among the states in the prevalence of behavioral health conditions, although the confidence intervals around the estimates are often wide. Table 1: Prevalence of Behavioral Health Conditions in Past Year Among Adults Aged 18–64 Years SMI Population (%) 95% CI SPD Population (%) 95% CI SUD Population (%) 95% CI National populationa 5.5 (5.4 - 5.7) 11.6 (11.3 - 11.8) 10.3 (10.1 - 10.5) Medicaid populationb 11.7 (10.9 - 12.5) 21.9 (21.0 - 22.9) 11.9 (11.2 - 12.7) 7.1 (6.6 - 7.8) 14.9 (14.1 - 15.7) 13.6 (12.8 - 14.4) 6.1 (5.5 - 6.6) 13.5 (12.8 - 14.3) 14.3 (13.5 - 15.1) Adults aged 18–64 years who are uninsured and whose family income is c < 139 percent of FPL Adults aged 18–64 years who are uninsured and whose family income is d between 133 and 399 percent of FPL SOURCE: National Survey on Drug Use and Health, 2008–2011. a The national population is defined as adults aged 18–64 years in the U.S. b The Medicaid population is the number of adults aged 18–64 years with current Medicaid coverage, including those who have dual eligibility for Medicare and Medicaid. c These individuals would be eligible for the Medicaid expansion population. d These individuals would be eligible for subsidies and may enroll in the Affordable Insurance Exchanges. Abbreviations: CI, confidence interval; FPL, federal poverty level; SMI, serious mental illness in past year; SPD, serious psychological distress in past year; SUD, substance use disorder in past year. 10 Table 2: Prevalence of Behavioral Health Conditions in Past Year Among Adults Aged 18–64 Years with Current Medicaid Coverage, by State State SMI Population (%) 95% CI SPD Population (%) 95% CI SUD Population (%) 95% CI Alabama 11.7 (7.0 - 18.7) 20.2 (15.0 - 26.6) 6.8 (3.8 - 11.9) Alaska 9.5 15.1 16.0 7.8 12.5 7.5 (4.4 - 19.5) (9.1 - 23.9) (10.2 - 24.3) (5.8 - 10.4) (5.9 - 24.5) (4.6 - 12.1) 14.0 24.0 24.3 15.3 31.3 23.1 (7.9 - 23.7) (17.8 - 31.5) (17.5 - 32.6) (12.6 - 18.5) (20.8 - 44.0) (15.1 - 33.7) 12.6 16.1 10.5 9.0 15.2 17.0 (7.9 - 19.6) (11.3 - 22.3) (6.9 - 15.6) (7.1 - 11.3) (8.8 - 25.0) (10.8 - 25.8) 12.8 3.5 8.6 15.7 12.2 17.4 (9.3 - 17.5) (2.1 - 5.8) (6.5 - 11.4) (7.8 - 29.2) (7.4 - 19.6) (10.0 - 28.6) 23.4 10.8 19.6 22.2 20.3 30.6 (18.4 - 29.1) (7.8 - 14.8) (16.2 - 23.5) (13.1 - 35.0) (14.4 - 27.9) (21.0 - 42.1) 15.1 16.0 12.1 12.0 16.1 14.2 (11.3 - 19.9) (11.4 - 21.9) (9.3 - 15.5) (6.3 - 21.5) (11.2 - 22.7) (8.0 - 23.9) 9.4 22.0 18.3 15.9 14.9 9.1 (7.3 - 12.0) (15.5 - 30.3) (12.6 - 25.8) (7.5 - 30.8) (9.3 - 23.0) (5.8 - 14.1) 18.0 30.9 32.7 26.0 25.8 21.7 (15.3 - 21.1) (23.4 - 39.6) (25.1 - 41.3) (15.8 - 39.8) (17.3 - 36.6) (16.3 - 28.1) 10.3 11.0 12.9 11.3 10.9 10.2 (8.3 - 12.7) (5.8 - 19.8) (7.6 - 21.2) (6.5 - 18.8) (5.1 - 21.5) (6.7 - 15.2) 12.1 8.9 12.8 10.8 13.0 8.7 22.4 (8.6 - 16.7) (4.4 - 17.1) (8.4 - 19.1) (8.8 - 13.3) (9.5 - 17.4) (5.7 - 13.2) (14.7 - 32.7) 21.8 21.4 18.0 23.5 20.8 19.3 35.4 (17.6 - 26.7) (15.0 - 29.7) (13.7 - 23.2) (20.2 - 27.1) (15.6 - 27.2) (15.0 - 24.4) (26.6 - 45.3) 11.8 14.7 17.3 12.6 14.4 5.5 12.4 (8.8 - 15.6) (8.8 - 23.3) (12.1 - 24.0) (10.2 - 15.4) (9.9 - 20.5) (3.1 - 9.6) (7.9 - 18.9) Arizona Arkansas California Colorado Connecticut Delaware District of Columbia Florida Georgia Hawaii Idaho Illinois Indiana Iowa Kansas Kentucky Louisiana Maine Maryland Massachusetts Michigan Minnesota Mississippi Missouri SOURCE: National Survey on Drug Use and Health, 2008–2011. Medicaid population is the number of adults aged 18–64 years with current Medicaid coverage, including those who have dual eligibility for Medicare and Medicaid. Abbreviations: CI, confidence interval; SMI, serious mental illness in past year; SPD, serious psychological distress in past year; SUD, substance use disorders in past year. 11 Table 2 continued: Prevalence of Behavioral Health Conditions in Past Year Among Adults Aged 18–64 Years with Current Medicaid Coverage, by State State SMI Population (%) 95% CI SPD Population (%) 95% CI SUD Population (%) 95% CI Montana 14.0 (8.9 - 21.4) 22.6 (15.7 - 31.4) 20.4 (14.3 - 28.2) Nebraska 9.9 27.7 26.5 10.7 11.7 9.5 (4.7 - 19.5) (16.4 - 42.6) (17.0 - 38.9) (6.9 - 16.2) (7.8 - 17.1) (7.7 - 11.8) 23.2 34.5 43.5 22.1 24.5 20.9 (15.0 - 34.1) (22.2 - 49.2) (30.9 - 57.1) (13.9 - 33.3) (18.5 - 31.7) (18.4 - 23.5) 10.5 23.0 9.5 15.9 15.8 11.5 (5.8 - 18.2) (9.4 - 46.2) (5.9 - 15.1) (9.6 - 25.3) (11.4 - 21.5) (9.6 - 13.6) 8.0 4.9 16.1 7.8 25.0 15.7 (4.2 - 14.9) (3.1 - 7.7) (13.6 - 19.0) (4.2 - 14.0) (15.9 - 37.0) (12.6 - 19.5) 24.4 16.8 26.0 18.1 35.1 27.7 (16.5 - 34.5) (11.9 - 23.2) (22.9 - 29.3) (12.6 - 25.3) (25.0 - 46.7) (23.6 - 32.2) 11.4 14.9 14.6 11.2 17.9 15.6 (6.6 - 19.0) (9.1 - 23.3) (12.1 - 17.4) (7.2 - 17.1) (11.4 - 27.0) (12.0 - 20.1) 13.2 7.9 5.5 16.2 7.9 24.8 19.0 8.0 (8.3 - 20.4) (4.1 - 14.8) (2.2 - 13.0) (11.1 - 23.1) (5.6 - 10.9) (13.9 - 40.2) (14.0 - 25.2) (5.0 - 12.7) 24.3 14.3 25.2 25.4 17.4 45.6 29.2 20.0 (17.5 - 32.7) (9.8 - 20.3) (14.9 - 39.2) (19.8 - 32.0) (14.1 - 21.4) (32.5 - 59.3) (23.4 - 35.7) (11.9 - 31.7) 12.8 11.0 26.7 10.7 9.1 9.8 18.3 7.3 (8.4 - 19.0) (6.3 - 18.6) (15.4 - 42.0) (6.9 - 16.2) (6.7 - 12.2) (5.7 - 16.1) (13.2 - 24.7) (4.2 - 12.1) Wisconsin 17.8 17.7 15.1 (9.6 - 30.6) (10.9 - 27.4) (10.1 - 22.0) 27.4 31.9 29.3 (21.3 - 34.5) (24.1 - 40.9) (22.1 - 37.5) 9.3 11.7 13.6 (4.8 - 17.3) (6.4 - 20.7) (8.9 - 20.5) Wyoming 14.9 (10.1 - 21.3) 22.7 (16.7 - 30.2) 17.3 (11.3 - 25.6) Nevada New Hampshire New Jersey New Mexico New York North Carolina North Dakota Ohio Oklahoma Oregon Pennsylvania Rhode Island South Carolina South Dakota Tennessee Texas Utah Vermont Virginia Washington West Virginia SOURCE: National Survey on Drug Use and Health, 2008–2011. Medicaid population is the number of adults aged 18–64 years with current Medicaid coverage, including those who have dual eligibility for Medicare and Medicaid. Abbreviations: CI, confidence interval; SMI, serious mental illness in past year; SPD, serious psychological distress in past year; SUD, substance use disorders in past year. 12 Table 3: Prevalence of Behavioral Health Conditions in Past Year Among Adults Aged 18–64 Years Who Are Uninsured and Have Annual Family Incomes < 139 Percent of Federal Poverty Level, by State State Alabama Alaska Arizona Arkansas California Colorado Connecticut Delaware District of Columbia Florida Georgia Hawaii Idaho Illinois Indiana Iowa Kansas Kentucky Louisiana Maine Maryland SMI Population (%) 95% CI 95% CI 24.0 18.6 13.8 22.8 (16.5 - 33.4) (12.0 - 27.5) (8.8 - 20.9) (17.3 - 29.4) 10.6 15.2 19.4 11.7 (7.0 - 15.7) (9.1 - 24.3) (13.9 - 26.4) (8.4 - 16.0) 5.0 4.7 12.2 13.0 7.0 7.7 (3.7 - 6.6) (2.1 - 10.0) (5.0 - 26.8) (6.0 - 25.7) (2.9 - 15.6) (5.6 - 10.4) 11.2 12.4 20.0 20.2 13.7 14.9 (9.0 - 13.7) (7.2 - 20.5) (10.0 - 36.0) (11.8 - 32.2) (6.8 - 25.8) (12.4 - 17.9) 9.7 12.5 24.5 10.9 30.5 11.3 (7.7 - 12.1) (8.1 - 18.8) (14.4 - 38.5) (6.9 - 16.9) (19.0 - 45.1) (9.2 - 13.7) 3.8 3.7 13.3 5.4 17.1 9.9 6.4 10.0 (2.1 - 6.9) (1.5 - 8.8) (8.4 - 20.4) (3.7 - 7.7) (12.0 - 23.9) (4.7 - 19.5) (2.8 - 13.9) (6.6 - 14.8) 11.4 9.2 22.7 12.5 24.3 19.2 14.0 19.2 (7.4 - 17.3) (4.5 - 18.0) (16.7 - 30.1) (9.8 - 16.0) (18.6 - 31.1) (11.8 - 29.8) (8.4 - 22.4) (14.6 - 24.8) 11.4 15.4 22.3 13.6 21.1 14.7 12.6 13.8 (7.2 - 17.7) (8.4 - 26.5) (15.0 - 31.8) (11.0 - 16.6) (15.8 - 27.5) (10.0 - 21.0) (7.8 - 19.8) (9.3 - 20.0) 7.4 9.3 2.4 (4.5 - 12.0) (4.2 - 19.4) (0.9 - 6.1) 16.5 17.9 11.4 10.4 18.7 26.6 19.5 15.3 (12.0 - 22.3) (10.6 - 28.6) (4.6 - 25.5) (4.0 - 24.3) (15.4 - 22.5) (15.3 - 42.0) (15.7 - 24.1) (11.1 - 20.8) 18.8 17.8 9.8 25.7 16.2 15.4 9.5 14.8 (13.7 - 25.3) (9.8 - 30.2) (5.4 - 17.1) (11.0 - 49.1) (13.3 - 19.7) (9.2 - 24.7) (6.8 - 13.1) (9.4 - 22.6) †N/A †N/A 8.3 16.9 10.1 7.9 (6.2 - 10.9) (7.7 - 33.4) (6.6 - 15.0) (4.7 - 13.0) Missouri SUD Population (%) (10.4 - 24.3) (1.9 - 7.5) (4.0 - 12.4) (6.7 - 15.5) Michigan Mississippi 95% CI 16.2 3.8 7.1 10.3 Massachusetts Minnesota SPD Population (%) SOURCE: National Survey on Drug Use and Health, 2008–2011. †N/A denotes insufficient sample size (<4 for the numerator and <30 for the denominator) and was suppressed according to SAMHSA guidelines. Abbreviations: CI, confidence interval; SMI, serious mental illness in past year; SPD, serious psychological distress in past year; SUD, substance use disorders in past year. 13 Table 3 continued: Prevalence of Behavioral Health Conditions in Past Year Among Adults Aged 18–64 Years Who Are Uninsured and Have Annual Family Incomes < 139 Percent of Federal Poverty Level, by State State SMI Population (%) 95% CI SPD Population (%) 95% CI SUD Population (%) 95% CI 7.3 9.1 (4.2 - 12.2) (5.1 - 15.8) 15.7 24.2 (11.0 - 21.8) (14.5 - 37.5) 19.2 17.2 (13.4 - 26.6) (10.1 - 27.8) 4.0 9.2 4.3 5.0 4.0 3.6 6.9 12.4 (2.0 - 7.9) (4.5 - 17.8) (1.1 - 15.4) (3.3 - 7.4) (2.6 - 6.3) (1.7 - 7.5) (3.3 - 13.9) (9.0 - 16.8) 11.4 13.1 7.5 14.7 12.1 11.4 14.0 24.7 (6.1 - 20.4) (7.9 - 20.9) (2.9 - 18.1) (9.4 - 22.0) (8.8 - 16.3) (6.8 - 18.5) (8.2 - 22.8) (19.8 - 30.3) 14.3 19.4 9.2 8.9 12.9 12.5 20.0 20.4 (8.5 - 22.9) (11.6 - 30.6) (4.5 - 17.9) (5.9 - 13.3) (9.5 - 17.2) (9.2 - 16.8) (12.6 - 30.1) (16.6 - 24.9) 7.3 10.6 6.3 8.2 11.4 5.7 (4.3 - 12.0) (6.2 - 17.5) (4.1 - 9.7) (4.0 - 16.2) (6.4 - 19.4) (2.6 - 12.1) 17.5 20.7 15.1 15.9 20.3 20.5 (12.0 - 24.9) (14.1 - 29.3) (11.5 - 19.6) (9.3 - 25.9) (13.5 - 29.3) (11.9 - 32.9) 14.0 15.5 18.9 21.1 19.1 19.0 (9.6 - 19.9) (9.9 - 23.4) (14.3 - 24.5) (13.6 - 31.1) (13.1 - 27.1) (11.7 - 29.3) Wisconsin 6.9 5.9 14.2 14.1 9.3 7.0 11.8 10.4 (3.8 - 12.0) (4.5 - 7.7) (8.8 - 22.0) (7.8 - 24.3) (4.8 - 17.2) (3.0 - 15.5) (7.1 - 19.1) (4.7 - 21.7) 18.7 11.4 24.4 23.3 20.3 11.4 23.7 17.6 (13.5 - 25.2) (9.6 - 13.5) (18.6 - 31.4) (15.0 - 34.4) (13.5 - 29.4) (6.6 - 18.9) (17.3 - 31.4) (9.7 - 29.6) 18.4 10.8 8.2 20.3 18.3 21.7 16.0 13.4 (12.9 - 25.7) (9.0 - 13.0) (4.6 - 14.5) (12.6 - 31.0) (11.2 - 28.4) (13.9 - 32.1) (11.4 - 21.9) (8.7 - 20.2) Wyoming 11.6 (5.7 - 21.9) 17.1 (10.3 - 27.1) 12.4 (7.6 - 19.6) Montana Nebraska Nevada New Hampshire New Jersey New Mexico New York North Carolina North Dakota Ohio Oklahoma Oregon Pennsylvania Rhode Island South Carolina South Dakota Tennessee Texas Utah Vermont Virginia Washington West Virginia SOURCE: National Survey on Drug Use and Health, 2008–2011. Abbreviations: CI, confidence interval; SMI, serious mental illness in past year; SPD, serious psychological distress in past year; SUD, substance use disorders in past year. 14 Table 4: Prevalence of Behavioral Health Conditions in Past Year Among Adults Aged 18–64 Years Who Are Uninsured and Have Annual Family Incomes Between 133 and 399 Percent of Federal Poverty Level, by State State SMI Population (%) 95% CI SPD Population (%) 95% CI SUD Population (%) 95% CI 8.7 (5.2 - 14.2) 20.4 (14.0 - 28.8) 12.8 (8.0 - 19.8) 9.6 4.1 10.2 5.0 5.9 3.0 (5.1 - 17.2) (2.2 - 7.3) (6.0 - 16.9) (3.5 - 7.1) (2.1 - 15.9) (1.0 - 8.1) 13.7 17.4 21.1 11.9 13.9 9.6 (8.5 - 21.4) (11.2 - 25.9) (14.6 - 29.6) (9.6 - 14.7) (7.1 - 25.2) (5.3 - 16.9) 14.8 14.6 13.5 13.8 24.4 15.1 (10.1 - 21.3) (10.0 - 20.7) (9.1 - 19.5) (11.3 - 16.7) (15.9 - 35.5) (9.4 - 23.4) 3.5 7.0 4.9 2.1 12.2 12.7 (1.5 - 7.6) (2.6 - 17.5) (3.6 - 6.8) (0.6 - 7.5) (5.0 - 26.6) (7.5 - 20.8) 7.5 10.6 10.3 5.1 13.7 20.1 (4.3 - 12.8) (5.3 - 20.0) (8.2 - 13.0) (2.5 - 10.1) (6.3 - 27.2) (13.4 - 29.0) 13.8 19.7 13.7 11.3 17.5 11.0 (9.1 - 20.5) (9.2 - 37.4) (11.3 - 16.6) (6.3 - 19.5) (10.2 - 28.3) (7.2 - 16.3) 6.8 6.7 6.0 8.6 7.8 5.6 (4.9 - 9.3) (4.0 - 11.1) (2.8 - 12.5) (4.4 - 16.1) (4.4 - 13.6) (3.3 - 9.4) 14.7 16.0 13.1 15.8 13.7 14.8 (12.0 - 17.9) (11.0 - 22.8) (8.4 - 19.9) (10.6 - 22.9) (8.8 - 20.7) (10.3 - 20.8) 16.2 8.6 15.4 18.1 10.6 12.1 (13.3 - 19.5) (5.3 - 13.6) (9.1 - 25.0) (11.8 - 26.8) (6.0 - 18.1) (7.9 - 18.1) Mississippi 1.5 3.3 9.3 7.2 9.6 8.5 (0.7 - 3.5) (1.5 - 7.1) (2.6 - 28.1) (5.4 - 9.5) (5.1 - 17.2) (4.9 - 14.3) 9.4 9.2 17.9 15.3 18.9 15.7 (4.8 - 17.7) (5.4 - 15.2) (9.0 - 32.5) (12.4 - 18.7) (11.1 - 30.2) (10.7 - 22.4) 12.6 12.0 18.1 17.6 16.9 11.4 (8.0 - 19.1) (7.2 - 19.2) (8.8 - 33.7) (14.6 - 21.0) (10.2 - 26.7) (7.2 - 17.6) Missouri 9.4 (5.5 - 15.5) 14.2 (9.6 - 20.4) 8.3 (5.3 - 12.7) Alabama Alaska Arizona Arkansas California Colorado Connecticut Delaware District of Columbia Florida Georgia Hawaii Idaho Illinois Indiana Iowa Kansas Kentucky Louisiana Maine Maryland Massachusetts Michigan Minnesota SOURCE: National Survey on Drug Use and Health, 2008–2011. Abbreviations: CI, confidence interval; SMI, serious mental illness in past year; SPD, serious psychological distress in past year; SUD, substance use disorders in past year. 15 Table 4 continued: Prevalence of Behavioral Health Conditions in Past Year Among Adults Aged 18–64 Years Who Are Uninsured and Have Annual Family Incomes Between 133 and 399 Percent of Federal Poverty Level, by State State SMI Population (%) 95% CI SPD Population (%) 95% CI SUD Population (%) 95% CI 5.7 10.7 (3.0 - 10.5) (6.0 - 18.5) 15.4 20.0 (9.7 - 23.8) (13.7 - 28.3) 15.3 19.3 (10.4 - 21.9) (12.1 - 29.2) 7.8 5.7 8.7 7.9 5.1 4.8 (4.6 - 12.8) (3.2 - 10.1) (4.1 - 17.5) (4.7 - 12.8) (3.7 - 7.2) (2.6 - 8.8) 12.9 14.3 14.2 11.5 11.2 11.8 (8.9 - 18.3) (9.3 - 21.3) (8.4 - 22.8) (7.8 - 16.7) (8.8 - 14.0) (8.2 - 16.6) 18.5 16.7 11.5 19.2 12.6 13.4 (12.9 - 25.9) (11.1 - 24.3) (6.8 - 18.8) (14.1 - 25.5) (9.6 - 16.4) (8.6 - 20.3) 7.4 7.9 7.8 6.7 4.3 13.0 (3.5 - 15.3) (5.4 - 11.3) (4.0 - 14.6) (3.3 - 13.2) (2.7 - 6.8) (7.2 - 22.3) 15.7 16.2 17.8 12.7 14.6 27.3 (8.7 - 26.6) (12.8 - 20.3) (12.9 - 24.1) (8.3 - 19.0) (11.1 - 19.0) (19.1 - 37.4) 22.0 18.7 19.5 16.4 16.1 29.6 (13.3 - 34.1) (15.1 - 22.9) (11.8 - 30.6) (10.8 - 24.3) (12.8 - 20.0) (21.4 - 39.3) 3.5 5.2 4.2 5.5 9.6 10.7 (1.7 - 6.7) (2.2 - 11.6) (2.1 - 8.3) (4.2 - 7.3) (5.3 - 16.7) (6.2 - 17.8) 17.6 12.3 15.1 12.6 15.4 20.2 (12.3 - 24.4) (6.4 - 22.3) (8.8 - 24.9) (10.3 - 15.3) (10.2 - 22.5) (12.5 - 30.9) 14.0 16.1 19.6 12.6 10.7 12.0 (9.2 - 20.8) (9.2 - 26.9) (12.6 - 29.2) (10.1 - 15.7) (6.7 - 16.7) (7.5 - 18.6) Wisconsin 7.3 6.4 9.3 12.0 (3.6 - 14.3) (3.4 - 11.9) (5.0 - 16.4) (5.7 - 23.6) 19.2 14.5 18.1 17.8 (11.8 - 29.7) (9.7 - 21.3) (11.5 - 27.4) (10.2 - 29.2) 23.2 10.6 8.9 13.5 (14.4 - 35.0) (6.8 - 16.3) (5.4 - 14.4) (8.8 - 20.2) Wyoming 8.9 (5.2 - 14.8) 17.6 (12.7 - 23.9) 15.5 (11.1 - 21.4) Montana Nebraska Nevada New Hampshire New Jersey New Mexico New York North Carolina North Dakota Ohio Oklahoma Oregon Pennsylvania Rhode Island South Carolina South Dakota Tennessee Texas Utah Vermont Virginia Washington West Virginia SOURCE: National Survey on Drug Use and Health, 2008–2011. Abbreviations: CI, confidence interval; SMI, serious mental illness in past year; SPD, serious psychological distress in past year; SUD, substance use disorders in past year. 16 Behavioral Health Utilization Estimates Table 5 displays national behavioral health services utilization estimates for: All adults in the United States (aged 18 to 64 years) Adult Medicaid enrollees (aged 18 to 64 years) Adults who are uninsured and have annual family incomes < 139 percent of FPL (the likely Medicaid expansion population) Adults who are uninsured and have annual family incomes between 133 and 399 percent of FPL (the likely Affordable Insurance Exchanges expansion population). Tables 6–8 present state-level estimates for the same populations. Table 6 presents state-level behavioral health utilization estimates for current adult Medicaid enrollees (aged 18 to 64 years). Table 7 presents state-level behavioral health utilization estimates for adults who are likely to enroll in the Medicaid expansion. Table 8 presents similar information for adults who are likely to enroll in the Affordable Insurance Exchanges expansion. The tables show the percentage of beneficiaries in the last year who used: 1. Any mental health treatment (e.g., inpatient, outpatient, or prescription drugs) 2. Any inpatient or outpatient mental health treatment 3. Any substance abuse treatment 4. Any inpatient mental health treatment 5. Any outpatient mental health treatment 6. Any prescription drug treatment for mental health 7. Any specialty substance abuse facility treatment Estimates were based on the 2008-2011 National Survey on Drug Use and Health (NSDUH). To reflect the uncertainty in the utilization estimates, all estimates are presented with confidence intervals. 17 Table 5: Receipt of Mental Health and Substance Use Treatment in Past Year Among Adults Aged 18–64 Years Any MH Treatment Any Inpatient or Outpatient MH Treatment Any SA Treatment Any Inpatient MH Treatment Any Outpatient MH Treatment Any Prescription Medication for MH Any Specialty SA Facility Treatment % % 95% CI % 95% CI % 95% CI % 95% CI % 95% CI % National populationa 14.4 (14.1 – 14.6) 7.6 (7.4 – 7.8) 1.9 (1.8 – 2.0) 0.8 (0.8 – 0.9) 7.3 (7.1 – 7.5) 12.1 (11.8 – 12.4) 1.2 (1.1 - 1.3) Medicaid populationb 24.0 (22.9 - 25.1) 14.7 (13.8 - 15.6) 4.4 (3.9 - 4.9) 3.3 (2.9 - 3.8) 13.6 (12.8 - 14.5) 20.7 (19.7 - 21.7) 3.4 (2.9 - 3.8) 8.9 (8.2 - 9.7) 4.9 (4.4 - 5.6) 3.4 (3.0 - 3.8) 0.9 (0.7 - 1.1) 4.5 (4.0 - 5.1) 7.4 (6.7 - 8.1) 2.3 (1.9 - 2.6) 9.0 (8.3 - 9.8) 4.3 (3.9 - 4.8) 2.8 (2.5 - 3.3) 0.7 (0.5 - 0.9) 4.1 (3.6 - 4.5) 7.5 (6.9 - 8.2) 1.8 (1.5 - 2.2) Adults aged 18–64 years who are uninsured and whose family income is c < 139 percent of FPL Adults aged 18–64 years who are uninsured and whose family income is between 133 and 399 d percent of FPL 95% CI SOURCE: National Survey on Drug Use and Health, 2008–2011. National population is defined as adults aged 18–64 in the U.S. b Medicaid population is the number of adults aged 18–64 years with current Medicaid coverage, including those who have dual eligibility for Medicare and Medicaid. c These individuals would be eligible for the Medicaid expansion population. d These individuals would be eligible for subsidies and may enroll in the Affordable Insurance Exchanges. Abbreviation: CO, confidence interval; FPL, federal poverty level; MH, mental health; SA, substance abuse. 18 95% CI Table 6: Receipt of Mental Health and Substance Use Treatment in Past Year Among Adults Aged 18–64 Years with Medicaid Coverage, by State State Any MH Treatment % 95% CI Any Inpatient or Outpatient MH Treatment % 95% CI Alabama 21.0 (14.1 - 30.2) 13.3 Alaska 19.0 (11.6 - 29.7) Arizona 23.5 (15.6 - 33.6) Arkansas 29.5 (20.5 - 40.3) California 14.9 Colorado 29.5 Connecticut Any SA Treatment % 95% CI Any Inpatient MH Treatment % 95% CI Any Outpatient MH Treatment % 95% CI Any Prescription Medication for MH % 95% CI Any Specialty SA Facility Treatment % 95% CI (0.6 - 7.6) 13.1 (7.0 - 23.2) 17.0 (11.3 - 24.6) 3.0 (1.1 - 7.9) (7.2 - 23.3) 3.0 (1.1 - 7.9) 2.2 13.1 (7.2 - 22.7) 8.1 (4.5 - 14.3) †N/A †N/A 13.1 (7.2 - 22.7) 15.2 (8.2 - 26.4) 4.9 (2.4 - 9.8) 18.1 (11.0 - 28.2) 4.3 (2.4 - 7.7) 1.5 (0.7 - 2.9) 17.3 (10.3 - 27.6) 19.3 (12.2 - 29.0) 3.8 (1.8 - 7.6) 16.9 (10.2 - 26.6) 5.9 (2.6 - 12.6) 3.9 (1.4 - 10.3) 14.6 (9.0 - 22.7) 27.7 (18.8 - 38.9) 2.9 (0.9 - 9.2) (11.9 - 18.6) 9.8 (7.4 - 12.9) 2.8 (1.8 - 4.3) 2.8 (1.6 - 5.0) 8.9 (6.6 - 11.9) 11.7 (9.1 - 15.0) 1.7 (0.9 - 3.3) (19.3 - 42.3) 15.4 (8.2 - 27.0) 5.5 (2.7 - 10.8) 6.9 (3.0 - 15.3) 15.4 (8.2 - 27.0) 26.9 (17.0 - 39.8) 3.1 (1.5 - 6.4) 23.1 (16.5 - 31.3) 18.2 (12.8 - 25.1) 8.0 (4.4 - 13.9) 3.0 (0.6 - 14.3) 18.2 (12.8 - 25.1) 17.9 (11.4 - 26.9) 7.4 (4.0 - 13.5) Delaware 23.5 (18.2 - 29.8) 16.0 (10.2 - 24.1) 9.2 (5.5 - 14.9) 1.9 (0.9 - 4.0) 15.9 (10.2 - 24.1) 21.4 (16.5 - 27.3) 8.3 (4.7 - 14.0) District of Columbia 13.5 (9.3 - 19.0) 10.5 (6.5 - 16.5) 12.3 (7.9 - 18.7) 1.1 (0.4 - 3.0) 10.3 (6.3 - 16.4) 10.5 (6.8 - 15.9) 9.6 (5.3 - 16.7) Florida 21.5 (17.7 - 26.0) 12.6 (9.4 - 16.5) 3.0 (1.9 - 4.7) 3.8 (2.2 - 6.4) 10.1 (7.4 - 13.5) 17.7 (14.2 - 21.9) 1.8 (1.1 - 3.2) Georgia 26.1 (16.9 - 38.0) 19.5 (11.2 - 31.7) 4.8 (1.5 - 13.8) 7.3 (3.3 - 15.5) 17.2 (9.2 - 30.0) 24.3 (15.2 - 36.7) †N/A †N/A Hawaii 20.2 (13.8 - 28.6) 14.9 (9.5 - 22.6) 3.6 (1.5 - 8.4) 3.6 (1.1 - 10.8) 14.3 (9.0 - 21.8) 16.0 (10.1 - 24.5) 2.0 (0.6 - 6.4) Idaho 38.3 (27.3 - 50.6) 18.2 (11.6 - 27.4) 5.4 (2.4 - 12.0) †N/A †N/A 18.2 (11.6 - 27.4) 36.1 (25.1 - 48.8) 4.9 (1.9 - 11.8) Illinois 17.6 (14.9 - 20.6) 9.4 (7.5 - 11.6) 3.9 (2.6 - 5.8) 2.2 (1.4 - 3.6) 8.9 (7.1 - 11.2) 15.3 (12.8 - 18.3) 3.0 (1.9 - 4.8) Indiana 28.4 (20.6 - 37.9) 16.7 (11.2 - 24.2) 5.1 (2.6 - 10.0) 3.5 (1.2 - 9.4) 16.6 (11.1 - 24.2) 27.5 (19.7 - 37.0) 3.8 (1.8 - 8.1) Iowa 36.1 (28.0 - 45.2) 22.1 (15.7 - 30.1) 3.0 (1.3 - 6.5) 6.4 (3.2 - 12.2) 21.8 (15.5 - 29.8) 34.3 (26.2 - 43.5) 1.8 (0.6 - 5.0) Kansas 24.7 (15.2 - 37.6) 13.5 (7.1 - 24.3) 6.8 (3.3 - 13.7) 5.3 (1.7 - 15.6) 11.0 (5.7 - 20.3) 21.4 (12.7 - 33.7) 6.3 (3.0 - 12.7) Kentucky 28.3 (20.2 - 38.0) 17.0 (10.6 - 26.0) 3.0 (1.3 - 6.8) 3.7 (1.7 - 8.2) 16.7 (10.4 - 25.7) 25.4 (17.4 - 35.4) 1.9 (0.7 - 5.0) Louisiana 20.0 (14.4 - 27.2) 11.0 (7.4 - 16.1) 0.9 (0.4 - 2.2) 2.6 (1.2 - 5.3) 8.7 (5.4 - 13.7) 17.4 (12.1 - 24.3) 0.6 (0.2 - 1.9) Maine 37.0 (31.6 - 42.8) 24.6 (19.4 - 30.6) 5.0 (3.1 - 8.0) 1.9 (1.0 - 3.7) 24.2 (19.0 - 30.4) 31.6 (26.7 - 37.0) 3.9 (2.1 - 7.0) SOURCE: National Survey on Drug Use and Health, 2008–2011. Medicaid population is the number of adults aged 18–64 years with current Medicaid coverage, including those who have dual eligibility for Medicare and Medicaid. †N/A denotes insufficient sample size (<4 for the numerator and <30 for the denominator) and was suppressed according to SAMHSA guidelines. Abbreviation: CI, confidence interval; MH, mental health; SA, substance abuse. 19 Table 6 continued: Receipt of Mental Health and Substance Use Treatment in Past Year Among Adults Aged 18–64 Years with Medicaid Coverage, by State State Any MH Treatment % 95% CI Any Inpatient or Outpatient MH Treatment % 95% CI Any SA Treatment % 95% CI Any Inpatient MH Treatment % 95% CI Any Outpatient MH Treatment % 95% CI Any Prescription Medication for MH % 95% CI Any Specialty SA Facility Treatment % 95% CI Maryland 20.2 (12.7 - 30.6) 14.1 (7.5 - 25.0) 9.0 (3.3 - 22.2) 6.5 (2.6 - 15.5) 12.3 (6.4 - 22.4) 14.9 (8.4 - 25.0) 7.7 (2.5 - 21.5) Massachusetts 25.0 (18.3 - 33.2) 18.6 (12.7 - 26.6) 5.3 (3.2 - 8.6) 1.9 (0.8 - 4.8) 18.5 (12.6 - 26.5) 19.7 (14.2 - 26.7) 3.9 (2.3 - 6.6) Michigan 22.5 (19.3 - 26.0) 12.9 (10.6 - 15.6) 6.6 (4.6 - 9.2) 2.9 (1.9 - 4.4) 11.7 (9.4 - 14.3) 18.9 (15.8 - 22.4) 4.7 (3.1 - 7.2) Minnesota 36.9 (29.0 - 45.6) 21.3 (15.9 - 27.9) 5.5 (2.9 - 10.3) 3.4 (1.4 - 8.3) 19.5 (14.3 - 25.9) 32.2 (24.0 - 41.8) 3.3 (1.6 - 6.6) Mississippi 18.2 (13.3 - 24.3) 6.2 (3.7 - 10.1) 1.5 (0.5 - 4.4) 2.0 (0.7 - 5.3) 5.9 (3.5 - 9.9) 17.3 (12.5 - 23.6) 1.0 (0.2 - 4.2) Missouri 36.5 (27.6 - 46.4) 29.2 (19.6 - 41.0) 1.3 (0.5 - 3.0) 6.3 (3.2 - 12.0) 28.4 (18.7 - 40.7) 33.8 (24.9 - 44.0) 1.2 (0.5 - 2.8) Montana 28.3 (18.9 - 40.1) 16.3 (9.4 - 26.8) 5.9 (2.5 - 13.5) 3.2 (0.9 - 11.3) 14.1 (8.1 - 23.3) 26.6 (16.8 - 39.5) 5.6 (2.2 - 13.4) Nebraska 35.5 (23.6 - 49.4) 18.9 (10.4 - 31.9) 1.9 (0.6 - 5.6) 2.9 (0.9 - 8.8) 17.6 (9.3 - 30.8) 30.9 (19.6 - 45.2) †N/A †N/A Nevada 28.3 (16.3 - 44.6) 22.3 (11.9 - 37.9) 6.1 (2.3 - 15.5) 10.1 (3.5 - 25.4) 16.9 (8.1 - 31.9) 21.8 (11.3 - 38.0) 5.8 (2.0 - 15.5) New Hampshire 48.9 (36.9 - 61.1) 35.0 (22.9 - 49.3) 6.4 (3.6 - 10.9) 5.2 (1.8 - 14.4) 34.6 (22.7 - 48.7) 43.6 (30.7 - 57.3) 4.5 (2.5 - 7.9) New Jersey 17.0 (10.0 - 27.4) 9.9 (5.8 - 16.4) 8.7 (4.2 - 17.2) 1.5 (0.6 - 3.9) 9.3 (5.0 - 16.4) 16.3 (9.4 - 26.9) 7.4 (3.4 - 15.4) New Mexico 22.4 (16.2 - 30.2) 14.5 (9.8 - 20.9) 4.5 (2.4 - 8.4) 3.7 (1.6 - 8.3) 13.5 (8.9 - 19.8) 19.1 (13.4 - 26.6) 1.9 (0.7 - 4.9) New York 20.4 (17.5 - 23.7) 14.3 (11.8 - 17.2) 5.1 (3.5 - 7.4) 3.8 (2.5 - 5.7) 13.1 (10.7 - 16.1) 16.1 (13.5 - 19.3) 4.9 (3.3 - 7.2) North Carolina 21.7 (14.5 - 31.2) 12.4 (7.2 - 20.5) 3.9 (1.5 - 9.7) 3.8 (1.5 - 8.9) 9.6 (5.5 - 16.3) 18.7 (12.3 - 27.3) 3.0 (1.0 - 8.2) North Dakota 21.9 (13.6 - 33.3) 13.8 (7.1 - 25.1) 3.3 (1.2 - 8.7) 1.4 (0.3 - 6.0) 13.5 (6.8 - 25.0) 20.6 (12.6 - 31.9) 2.9 (0.9 - 9.0) Ohio 31.7 (27.6 - 36.2) 18.8 (15.8 - 22.3) 5.1 (3.5 - 7.3) 4.0 (2.5 - 6.4) 17.7 (14.7 - 21.2) 29.4 (25.1 - 34.0) 3.3 (2.1 - 5.1) Oklahoma 23.5 (16.4 - 32.4) 14.7 (9.1 - 22.9) 2.7 (0.7 - 9.9) 2.8 (1.1 - 7.0) 14.0 (8.5 - 22.1) 21.4 (14.8 - 29.9) 2.7 (0.7 - 10.0) Oregon 41.3 (32.6 - 50.7) 21.6 (14.1 - 31.6) 9.1 (4.7 - 17.2) †N/A †N/A 19.3 (12.4 - 28.8) 31.9 (23.5 - 41.8) 8.5 (4.2 - 16.6) Pennsylvania 35.3 (30.7 - 40.2) 19.9 (16.1 - 24.3) 6.7 (4.5 - 9.8) 3.4 (1.9 - 6.1) 19.1 (15.4 - 23.5) 32.1 (27.5 - 37.2) 5.9 (3.8 - 9.1) Rhode Island 36.5 (27.7 - 46.3) 23.2 (16.4 - 31.6) 4.2 (2.2 - 8.0) 6.0 (3.0 - 11.6) 22.9 (16.2 - 31.4) 32.4 (24.0 - 42.1) 4.1 (2.1 - 8.0) SOURCE: National Survey on Drug Use and Health, 2008–2011. Medicaid population is the number of adults aged 18–64 years with current Medicaid coverage, including those who have dual eligibility for Medicare and Medicaid. †N/A denotes insufficient sample size (<4 for the numerator and <30 for the denominator) and was suppressed according to SAMHSA guidelines. Abbreviation: CI, confidence interval; MH, mental health; SA, substance abuse. 20 Table 6 continued: Receipt of Mental Health and Substance Use Treatment in Past Year Among Adults Aged 18–64 Years with Medicaid Coverage, by State State Any MH Treatment % 95% CI Any Inpatient or Outpatient MH Treatment % 95% CI Any SA Treatment % 95% CI Any Inpatient MH Treatment % 95% CI Any Outpatient MH Treatment % 95% CI Any Prescription Medication for MH % 95% CI Any Specialty SA Facility Treatment % 95% CI South Carolina 23.7 (16.8 - 32.3) 13.0 (8.7 - 19.1) 0.7 (0.2 - 2.8) 4.4 (1.8 - 10.2) 12.4 (8.1 - 18.5) 22.5 (15.7 - 31.2) 0.7 (0.2 - 2.8) South Dakota 36.1 (23.5 - 51.0) 13.0 (6.7 - 23.9) 7.4 (3.2 - 16.2) 1.4 (0.6 - 3.2) 12.5 (6.2 - 23.5) 32.0 (20.1 - 46.6) 3.8 (1.5 - 9.1) Tennessee 26.1 (20.3 - 32.9) 14.5 (10.1 - 20.3) 2.5 (1.2 - 5.0) 3.3 (1.5 - 7.4) 13.1 (9.1 - 18.7) 24.9 (19.2 - 31.6) 1.9 (0.8 - 4.3) Texas 20.8 (16.4 - 25.9) 10.1 (7.2 - 14.2) 2.5 (1.2 - 5.0) 2.0 (1.0 - 3.9) 9.8 (7.0 - 13.7) 18.0 (14.0 - 23.0) 1.0 (0.4 - 3.0) Utah 45.3 (31.7 - 59.6) 35.0 (22.8 - 49.6) 5.1 (2.2 - 11.5) 2.6 (0.7 - 8.7) 33.7 (21.7 - 48.3) 37.0 (24.7 - 51.4) 2.0 (0.7 - 5.4) Vermont 35.4 (28.7 - 42.8) 19.9 (14.0 - 27.4) 9.3 (5.5 - 15.4) 3.9 (2.1 - 7.2) 18.8 (13.2 - 26.1) 31.5 (25.4 - 38.4) 5.6 (3.5 - 8.7) Virginia 27.0 (19.4 - 36.3) 17.3 (9.7 - 28.8) †N/A †N/A 3.4 (1.4 - 8.2) 14.7 (8.2 - 25.0) 24.6 (17.1 - 34.1) †N/A †N/A Washington 36.1 (26.8 - 46.7) 18.5 (13.6 - 24.8) 6.1 (2.5 - 14.3) 3.4 (1.4 - 8.2) 16.7 (11.6 - 23.3) 29.6 (21.2 - 39.5) 5.6 (2.1 - 14.0) West Virginia 35.3 (27.0 - 44.7) 20.1 (12.8 - 30.0) 9.3 (4.2 - 19.3) 6.8 (2.5 - 17.0) 19.3 (12.4 - 28.9) 32.5 (24.6 - 41.4) 7.0 (2.7 - 16.8) Wisconsin 31.0 (22.5 - 40.9) 13.4 (8.7 - 19.8) 5.2 (2.7 - 9.7) 1.6 (0.6 - 3.8) 13.0 (8.4 - 19.5) 28.0 (20.7 - 36.7) 4.3 (2.1 - 8.7) Wyoming 31.1 (21.8 - 42.2) 22.1 (14.3 - 32.6) 11.1 (6.2 - 19.0) 3.2 (1.2 - 8.0) 21.0 (13.2 - 31.6) 29.0 (20.5 - 39.3) 10.5 (5.7 - 18.5) SOURCE: National Survey on Drug Use and Health, 2008–2011. Medicaid population is the number of adults aged 18–64 years with current Medicaid coverage, including those who have dual eligibility for Medicare and Medicaid. †N/A denotes insufficient sample size (<4 for the numerator and <30 for the denominator) and was suppressed according to SAMHSA guidelines. Abbreviation: CI, confidence interval; MH, mental health; SA, substance abuse. 21 Table 7: Receipt of Mental Health and Substance Use Treatment in Past Year Among Adults Aged 18–64 Years Who Are Uninsured and Have Annual Family Incomes < 139 Percent of Federal Poverty Level, by State State Alabama Any MH Treatment % 95% CI Any Inpatient or Outpatient MH Treatment % 95% CI Any SA Treatment % 95% CI Any Inpatient MH Treatment % 95% CI Any Outpatient MH Treatment % 95% CI Any Prescription Medication for MH % 95% CI 14.2 (9.1 - 21.6) 7.7 (3.5 - 16.2) 5.4 (3.0 - 9.7) 1.3 (0.5 - 3.4) 7.2 (3.1 - 15.8) 11.8 (7.0 - 19.4) Alaska 6.6 (3.4 - 12.2) 3.9 (1.6 - 9.0) 2.7 (0.8 - 8.5) †N/A †N/A 3.8 (1.5 - 8.9) 3.9 Arizona 5.7 (2.8 - 11.6) 2.2 (0.7 - 6.5) 4.3 (2.1 - 8.6) †N/A †N/A 2.0 (0.6 - 6.5) 4.4 Arkansas 10.7 (7.0 - 16.1) 5.2 (2.7 - 9.9) 1.5 (0.7 - 3.3) 0.6 (0.2 - 1.9) 5.1 (2.6 - 9.8) 10.0 California 4.3 (3.0 - 6.1) 2.9 (1.8 - 4.4) 3.6 (2.4 - 5.4) 0.5 (0.2 - 1.4) 2.5 (1.6 - 4.1) Colorado 6.0 (2.9 - 11.7) 4.7 (1.9 - 11.0) 2.5 (0.8 - 7.8) †N/A †N/A 4.6 (1.9 - 10.9) Connecticut 8.8 (3.0 - 23.4) 6.6 (1.8 - 21.3) †N/A †N/A †N/A †N/A †N/A Delaware 5.3 (1.3 - 19.1) 4.9 (1.1 - 19.4) 4.0 (0.7 - 21.0) †N/A †N/A District of Columbia 3.6 (1.4 - 8.7) 2.6 (0.8 - 7.8) 0.6 (0.2 - 2.2) †N/A †N/A Florida 7.9 (5.7 - 10.8) 4.3 (2.8 - 6.7) 3.8 (2.4 - 5.9) 1.1 (0.6 - 2.0) Georgia Any Specialty SA Facility Treatment % 95% CI 4.1 (2.0 - 8.2) (1.8 - 8.5) 2.2 (0.7 - 6.9) (1.9 - 9.9) †N/A †N/A (6.3 - 15.4) 1.1 (0.4 - 3.0) 2.7 (1.8 - 4.2) 2.2 (1.3 - 3.7) 5.4 (2.5 - 11.3) 2.3 (0.6 - 7.8) †N/A 6.3 (1.5 - 22.2) †N/A †N/A 4.9 (1.1 - 19.4) †N/A †N/A †N/A †N/A †N/A †N/A 1.7 (0.5 - 5.0) †N/A †N/A 3.8 (2.3 - 6.1) 6.7 (4.7 - 9.3) 2.0 (1.1 - 3.6) 8.6 (5.2 - 14.0) 5.6 (2.0 - 14.8) †N/A †N/A †N/A †N/A 5.5 (1.9 - 14.8) 7.2 (4.3 - 11.8) †N/A †N/A Hawaii †N/A †N/A †N/A †N/A †N/A †N/A †N/A †N/A †N/A †N/A †N/A †N/A †N/A †N/A Idaho 17.2 (10.4 - 27.0) 11.2 (6.5 - 18.6) 7.5 (3.5 - 15.4) †N/A †N/A 11.2 (6.5 - 18.6) 14.6 (8.3 - 24.3) 4.5 (1.7 - 11.5) Illinois 6.9 (4.9 - 9.6) 4.5 (3.0 - 6.8) 2.8 (1.7 - 4.7) 1.6 (0.8 - 3.5) 3.8 (2.5 - 5.9) 4.6 (3.0 - 6.8) 1.8 (1.1 - 3.1) Indiana 22.3 (14.5 - 32.7) 10.3 (5.6 - 18.0) 6.4 (3.2 - 12.3) 3.9 (1.4 - 10.3) 8.3 (4.7 - 14.2) 18.0 (11.0 - 28.1) 2.8 (1.3 - 5.9) Iowa 11.5 (5.8 - 21.4) 6.5 (3.2 - 12.7) 3.3 (1.5 - 6.8) †N/A †N/A 6.3 (3.2 - 12.4) 9.7 (4.6 - 19.5) 2.4 (1.0 - 5.9) Kansas 10.5 (5.6 - 18.7) 5.8 (2.3 - 14.0) 1.6 (0.4 - 6.6) †N/A †N/A 5.6 (2.1 - 13.9) 9.5 (4.7 - 18.3) †N/A †N/A Kentucky 11.3 (7.4 - 17.0) 5.4 (3.1 - 9.4) 4.7 (2.4 - 9.1) 0.8 (0.2 - 2.4) 4.7 (2.5 - 8.8) 10.5 (6.5 - 16.4) 3.1 (1.3 - 7.4) Louisiana 8.6 (6.1 - 12.2) 5.1 (3.4 - 7.7) 2.7 (1.2 - 6.0) 1.2 (0.4 - 3.6) 4.4 (3.0 - 6.5) 6.8 (4.4 - 10.4) 2.0 (0.8 - 5.0) Maine 7.3 (3.0 - 16.5) 2.2 (0.7 - 6.4) †N/A †N/A †N/A †N/A 1.9 (0.6 - 6.2) 6.6 (2.6 - 16.1) †N/A †N/A SOURCE: National Survey on Drug Use and Health, 2008–2011. †N/A denotes insufficient sample size (<4 for the numerator and <30 for the denominator) and was suppressed according to SAMHSA guidelines. Abbreviation: CI, confidence interval; MH, mental health; SA, substance abuse. 22 Table 7 continued: Receipt of Mental Health and Substance Use Treatment in Past Year Among Adults Aged 18–64 Years Who Are Uninsured and Have Annual Family Incomes < 139 Percent of Federal Poverty Level, by State State Maryland Massachusetts Michigan Minnesota Mississippi Any MH Treatment % 95% CI Any Inpatient or Outpatient MH Treatment % 95% CI Any SA Treatment % 95% CI Any Inpatient MH Treatment % 95% CI (1.5 - 12.8) †N/A †N/A †N/A 4.6 (1.5 - 12.8) 4.6 13.6 (4.9 - 32.4) †N/A †N/A †N/A †N/A 9.4 (6.9 - 12.5) 4.9 (3.2 - 7.5) 4.4 (3.0 - 6.3) 11.0 (5.8 - 20.1) 7.6 (3.2 - 16.8) 2.3 Any Outpatient MH Treatment % 95% CI †N/A 2.6 †N/A †N/A 1.1 (0.4 - 3.0) (1.0 - 5.2) †N/A Any Prescription Medication for MH % 95% CI Any Specialty SA Facility Treatment % 95% CI (0.6 - 9.8) 3.8 (1.1 - 12.3) †N/A †N/A †N/A †N/A 8.8 (2.5 - 26.1) †N/A †N/A 4.6 (2.9 - 7.1) 8.1 (5.8 - 11.2) 3.5 (2.3 - 5.3) †N/A 6.6 (2.6 - 15.7) 9.0 (4.1 - 18.4) 2.3 (1.0 - 5.2) 9.3 (5.0 - 16.7) 4.1 (1.8 - 9.0) 1.3 (0.5 - 3.4) †N/A †N/A 4.1 (1.8 - 9.0) 9.0 (4.7 - 16.5) †N/A †N/A Missouri 16.2 (8.5 - 28.7) 6.3 (3.2 - 12.1) 4.7 (1.8 - 11.9) 1.3 (0.5 - 3.4) 5.4 (2.5 - 11.3) 14.4 (7.1 - 27.0) 4.7 (1.8 - 11.9) Montana 11.2 (6.8 - 17.9) 3.5 (1.5 - 7.8) 3.7 (1.6 - 8.0) 1.3 (0.6 - 3.0) 2.8 (1.1 - 7.2) 9.5 (5.6 - 15.6) 3.1 (1.2 - 7.8) Nebraska 14.4 (8.7 - 23.0) 5.5 (2.7 - 11.0) 1.9 (0.7 - 5.1) †N/A †N/A 5.4 (2.6 - 10.8) 11.6 (6.6 - 19.6) †N/A †N/A Nevada 9.2 (4.2 - 19.1) 3.7 (1.4 - 9.4) 2.2 (0.8 - 5.7) †N/A †N/A 3.7 (1.4 - 9.4) 7.9 (3.5 - 17.1) 1.2 (0.3 - 4.4) New Hampshire 7.5 (4.2 - 13.0) 5.9 (3.0 - 11.1) 6.7 (2.4 - 17.4) †N/A †N/A 5.9 (3.0 - 11.1) 4.5 (1.9 - 10.1) 6.7 (2.4 - 17.4) New Jersey 4.3 (0.9 - 17.7) 4.1 (0.8 - 18.0) †N/A †N/A †N/A †N/A 3.8 (0.7 - 18.5) 3.7 (0.6 - 18.8) †N/A †N/A New Mexico 7.9 (4.2 - 14.4) 4.9 (2.2 - 10.8) 6.8 (3.8 - 11.8) 1.2 (0.3 - 4.1) 4.3 (1.7 - 10.2) 6.7 (3.4 - 12.9) 3.9 (2.0 - 7.2) New York 6.7 (4.2 - 10.6) 4.3 (2.3 - 7.8) 3.3 (1.7 - 6.1) 1.1 (0.3 - 3.8) 4.0 (2.1 - 7.6) 5.5 (3.3 - 9.1) 3.0 (1.5 - 5.9) North Carolina 8.3 (4.9 - 13.9) 4.5 (2.2 - 8.8) 2.5 (1.3 - 4.8) 0.9 (0.3 - 2.3) 4.0 (1.9 - 8.3) 8.0 (4.6 - 13.7) 2.0 (0.9 - 4.4) North Dakota 7.4 (3.1 - 16.6) 4.3 (1.2 - 14.2) 1.7 (0.6 - 5.1) †N/A †N/A 4.3 (1.2 - 14.2) 4.8 (1.9 - 11.6) 1.7 (0.6 - 5.1) 16.9 (12.3 - 22.9) 11.1 (7.3 - 16.6) 5.8 (3.8 - 8.7) 1.0 (0.4 - 2.2) 10.4 (6.7 - 15.8) 15.0 5.3 (3.4 - 8.1) Ohio Oklahoma (10.5 - 20.8) 9.6 (5.9 - 15.0) 4.1 (2.0 - 8.2) 4.2 (2.1 - 8.2) †N/A †N/A 3.9 (1.9 - 8.1) 8.8 (5.4 - 14.2) 2.8 (1.2 - 6.5) Oregon 15.4 (9.0 - 25.1) 9.8 (4.3 - 20.7) 4.8 (2.2 - 9.9) †N/A †N/A 9.8 (4.3 - 20.7) 8.0 (4.3 - 14.4) 4.4 (1.9 - 9.9) Pennsylvania 11.4 (7.8 - 16.4) 7.4 (4.8 - 11.4) 4.7 (2.7 - 8.2) 1.8 (0.7 - 4.7) 6.2 (3.9 - 9.9) 7.8 (4.7 - 12.7) 3.9 (2.1 - 7.2) Rhode Island 7.1 (3.2 - 15.3) 4.9 (1.9 - 11.8) 7.2 (2.2 - 20.8) †N/A †N/A 3.5 (1.3 - 9.2) 4.8 (1.9 - 11.9) 6.9 (2.1 - 20.9) SOURCE: National Survey on Drug Use and Health, 2008–2011. †N/A denotes insufficient sample size (<4 for the numerator and <30 for the denominator) and was suppressed according to SAMHSA guidelines. Abbreviation: CI, confidence interval; MH, mental health; SA, substance abuse. 23 Table 7 continued: Receipt of Mental Health and Substance Use Treatment in Past Year Among Adults Aged 18–64 Years Who Are Uninsured and Have Annual Family Incomes < 139 Percent of Federal Poverty Level, by State State Any MH Treatment % 95% CI Any Inpatient or Outpatient MH Treatment % 95% CI Any SA Treatment % 95% CI South Carolina 14.4 (8.9 - 22.6) 5.2 (2.9 - 9.2) 4.7 (2.2 - 9.7) South Dakota 19.5 (12.5 - 29.1) 9.9 (5.7 - 16.8) 2.4 Tennessee 10.3 (7.1 - 14.7) 5.4 (3.0 - 9.5) 1.8 Texas 7.4 (5.5 - 9.8) 3.3 (2.1 - 5.1) 2.2 Utah 11.5 (6.3 - 20.1) 6.1 (2.4 - 14.6) Vermont 10.5 (4.9 - 21.2) 7.0 (2.4 - 18.9) Virginia 12.5 (6.7 - 22.1) 8.6 Washington 10.9 (5.0 - 22.3) West Virginia 19.2 (12.6 - 28.2) Wisconsin 9.5 Wyoming 13.3 Any Inpatient MH Treatment % 95% CI Any Outpatient MH Treatment % 95% CI Any Prescription Medication for MH % 95% CI Any Specialty SA Facility Treatment % 95% CI 1.4 (0.4 - 5.4) 5.0 (2.7 - 9.0) 14.1 (8.6 - 22.4) 4.0 (1.7 - 9.1) (0.6 - 9.0) 3.4 (1.0 - 10.7) 8.1 (4.2 - 14.9) 17.6 (11.2 - 26.7) †N/A †N/A (0.7 - 4.5) †N/A †N/A 5.2 (2.8 - 9.3) 9.4 (6.3 - 13.8) †N/A †N/A (1.4 - 3.2) 0.7 (0.4 - 1.4) 3.1 (1.9 - 4.8) 6.1 (4.5 - 8.3) 1.2 (0.7 - 1.9) 3.1 (1.6 - 6.0) †N/A †N/A 6.1 (2.4 - 14.6) 10.8 (5.6 - 19.6) 1.1 (0.3 - 4.1) 5.8 (2.7 - 12.0) †N/A †N/A 7.0 (2.4 - 18.9) 5.1 (2.3 - 11.0) †N/A †N/A (3.9 - 17.8) 1.3 (0.4 - 4.5) †N/A †N/A 7.7 (3.3 - 16.8) 10.1 (5.0 - 19.6) †N/A †N/A 6.6 (2.6 - 16.0) 4.7 (1.8 - 11.9) †N/A †N/A 6.2 (2.3 - 15.6) 8.9 (4.1 - 18.5) 4.1 (1.4 - 11.6) 6.9 (3.4 - 13.6) 4.5 (2.0 - 9.8) 0.6 (0.2 - 1.4) 6.8 (3.2 - 13.7) 18.5 (11.9 - 27.7) 3.2 (1.5 - 6.8) (5.2 - 16.9) 5.9 (2.6 - 12.8) 7.5 (3.2 - 16.6) †N/A †N/A 5.8 (2.5 - 12.7) 9.5 (5.2 - 16.8) 6.2 (2.2 - 16.1) (8.2 - 20.7) 5.3 (2.7 - 10.4) 2.3 (0.9 - 5.7) †N/A †N/A 5.3 (2.6 - 10.4) 12.1 (7.3 - 19.3) 1.1 (0.3 - 4.1) SOURCE: National Survey on Drug Use and Health, 2008–2011. †N/A denotes insufficient sample size (<4 for the numerator and <30 for the denominator) and was suppressed according to SAMHSA guidelines. Abbreviation: CI, confidence interval; MH, mental health; SA, substance abuse. 24 Table 8: Receipt of Mental Health and Substance Use Treatment in Past Year Among Adults Aged 18–64 Years Who are Uninsured and Have Annual Family Incomes Between 133 and 399 Percent of Federal Poverty Level, by State State Alabama Any MH Treatment % 95% CI 10.5 3.4 (1.1 - 10.2) †N/A †N/A (2.6 - 8.5) 3.1 (1.7 - 5.5) 3.5 (1.5 - 8.1) †N/A (3.2 - 14.2) †N/A †N/A 1.4 (0.4 - 4.0) †N/A (11.6 - 30.4) 4.8 (1.8 - 12.2) 2.9 (1.1 - 7.4) 7.1 (5.2 - 9.6) 3.3 (2.2 - 5.0) 1.9 9.9 (4.6 - 19.9) 5.3 (2.7 - 10.4) 2.3 8.3 (3.5 - 18.4) 0.9 (0.2 - 3.8) 4.8 6.9 Arkansas 19.3 California Colorado Connecticut District of Columbia Florida Any Inpatient MH Treatment % 95% CI (2.9 - 17.3) Arizona Delaware Any SA Treatment % 95% CI 7.3 Alaska (5.4 - 19.4) Any Inpatient or Outpatient MH Treatment % 95% CI Any Outpatient MH Treatment % 95% CI Any Prescription Medication for MH % 95% CI Any Specialty SA Facility Treatment % 95% CI 2.1 (0.5 - 7.9) (1.0 - 5.5) 7.3 (2.9 - 17.3) 10.1 (5.1 - 19.0) †N/A 3.1 (1.7 - 5.5) 2.7 (1.0 - 6.9) 2.4 †N/A †N/A †N/A 6.9 (3.2 - 14.2) †N/A †N/A †N/A 4.8 (1.8 - 12.2) 19.2 (11.5 - 30.2) 2.0 (0.6 - 6.8) (1.0 - 3.3) 0.5 (0.1 - 1.9) 3.0 (1.9 - 4.5) 5.0 (3.4 - 7.3) 1.2 (0.6 - 2.6) (1.0 - 5.1) †N/A †N/A 5.0 (2.4 - 10.1) 7.4 (2.9 - 17.7) 0.8 (0.3 - 2.6) 3.6 (1.5 - 8.1) †N/A †N/A 0.9 (0.2 - 3.8) 7.3 (2.8 - 17.8) 1.7 (0.5 - 5.8) (0.6 - 3.6) †N/A 7.8 (3.9 - 15.0) 5.4 (2.5 - 11.3) 1.6 (0.7 - 3.8) †N/A †N/A 5.4 (2.5 - 11.3) 6.4 (2.8 - 14.0) 1.4 11.0 (4.6 - 24.3) 6.7 (2.3 - 17.8) 2.3 (0.5 - 9.2) †N/A †N/A †N/A †N/A 8.6 (2.9 - 22.9) †N/A 7.5 (5.7 - 9.8) 3.3 (2.2 - 5.0) 2.5 (1.5 - 4.0) 0.7 (0.3 - 1.6) 3.1 (2.0 - 4.7) 7.1 (5.3 - 9.3) 1.9 (1.0 - 3.3) 0.7 (0.2 - 2.4) Georgia 2.5 (1.2 - 4.9) 2.0 (0.8 - 4.9) 2.2 (0.7 - 6.6) †N/A †N/A 1.7 (0.6 - 4.6) 0.9 (0.4 - 2.1) Hawaii 10.6 (4.3 - 23.8) 8.0 (2.9 - 20.3) †N/A †N/A †N/A †N/A †N/A †N/A †N/A †N/A Idaho 16.2 (9.6 - 26.2) 8.5 (4.3 - 15.9) 5.7 (1.9 - 15.9) †N/A †N/A 8.5 (4.3 - 15.9) 15.6 (9.0 - 25.8) Illinois 8.3 (5.9 - 11.5) 3.3 (2.1 - 5.1) 1.8 (1.1 - 3.1) 0.3 (0.1 - 0.6) 3.1 (2.0 - 4.9) 6.8 Indiana 9.6 (5.8 - 15.5) 6.3 (3.2 - 11.8) 2.4 (0.8 - 6.8) †N/A †N/A 6.3 (3.2 - 11.8) 8.4 Iowa 12.6 (6.8 - 22.2) 6.0 (2.7 - 12.7) 3.4 (1.4 - 8.4) †N/A †N/A 6.0 (2.7 - 12.7) Kansas †N/A †N/A †N/A 2.0 (0.9 - 4.5) (4.6 - 10.0) 1.4 (0.8 - 2.5) (4.9 - 14.1) †N/A 9.3 (4.4 - 18.7) 2.6 (0.9 - 7.4) (0.2 - 2.2) †N/A 16.5 (10.9 - 24.2) 10.8 (6.0 - 18.7) 1.9 (0.6 - 5.8) †N/A †N/A 10.8 (6.0 - 18.7) 12.7 (7.5 - 20.8) 0.6 Kentucky 6.9 (4.3 - 10.9) 3.8 (1.5 - 9.3) 3.4 (1.9 - 5.8) †N/A †N/A 3.3 (1.3 - 8.3) 6.4 (3.9 - 10.2) †N/A Louisiana 7.0 (4.2 - 11.4) 3.6 (1.6 - 7.6) 1.6 (0.5 - 4.8) †N/A †N/A 3.2 (1.3 - 7.7) 6.5 (3.7 - 11.0) 1.6 (0.5 - 4.8) 10.9 (7.4 - 15.9) 5.5 (3.2 - 9.2) 3.1 (1.2 - 8.0) †N/A †N/A 4.2 (2.5 - 7.0) 8.5 (5.0 - 14.2) 1.2 (0.2 - 6.1) Maine SOURCE: National Survey on Drug Use and Health, 2008–2011. †N/A denotes insufficient sample size (<4 for the numerator and <30 for the denominator) and was suppressed according to SAMHSA guidelines. Abbreviation: CI, confidence interval; MH, mental health; SA, substance abuse. 25 †N/A Table 8 continued: Receipt of Mental Health and Substance Use Treatment in Past Year Among Adults Aged 18–64 Years Who are Uninsured and Have Annual Family Incomes Between 133 and 399 Percent of Federal Poverty Level, by State State Maryland Any MH Treatment % 95% CI Any Inpatient or Outpatient MH Treatment % 95% CI Any SA Treatment % 95% CI 5.8 (2.8 - 11.3) 3.6 (1.7 - 7.7) 3.2 13.6 (6.7 - 25.7) 7.1 (3.2 - 15.0) 9.4 (7.0 - 12.6) 4.5 (2.9 - 7.0) Minnesota 11.5 (4.2 - 27.7) 8.7 Mississippi 11.5 (6.8 - 18.9) Missouri 12.7 (6.9 - 22.3) Montana 14.1 Nebraska Any Inpatient MH Treatment % 95% CI (1.1 - 8.8) †N/A †N/A †N/A 4.0 (2.6 - 6.0) (2.5 - 26.0) †N/A †N/A 7.3 (3.5 - 14.6) 2.4 4.8 (2.4 - 9.1) 5.1 (8.8 - 21.9) 3.0 (1.4 - 6.2) 4.2 17.6 (11.6 - 25.8) 8.3 (4.4 - 15.2) 6.1 (3.7 - 10.0) 1.4 (0.4 - 4.3) New Hampshire 14.6 (9.9 - 20.9) 8.3 New Jersey 10.7 (5.3 - 20.6) New Mexico 7.4 (3.7 - 14.3) New York 4.5 North Carolina North Dakota Any Outpatient MH Treatment % 95% CI Any Prescription Medication for MH % 95% CI Any Specialty SA Facility Treatment % 95% CI †N/A 3.3 (1.5 - 7.3) 4.3 (1.8 - 9.7) 3.2 †N/A †N/A 6.5 (2.8 - 14.5) 13.0 (6.4 - 24.7) †N/A †N/A 1.0 (0.5 - 2.2) 4.1 (2.5 - 6.6) 7.7 (5.6 - 10.4) 2.8 (1.7 - 4.5) †N/A †N/A 8.7 (2.5 - 26.0) 11.2 (4.0 - 27.6) †N/A †N/A (0.9 - 6.4) 1.7 (0.4 - 6.9) 5.8 (2.7 - 11.7) 9.8 (5.8 - 16.2) 1.4 (0.5 - 4.2) (1.9 - 13.2) †N/A †N/A 4.8 (2.4 - 9.1) 11.9 (6.2 - 21.6) 1.7 (0.6 - 5.2) (2.2 - 7.8) †N/A †N/A 2.9 (1.4 - 6.1) 13.3 (8.1 - 21.1) 3.9 (1.9 - 7.7) 4.7 (1.8 - 11.9) †N/A †N/A 6.7 (3.5 - 12.5) 15.0 (9.5 - 22.8) 3.7 (1.3 - 10.5) 4.8 (2.2 - 10.1) 0.5 (0.1 - 1.4) 0.9 (0.2 - 4.5) 5.1 (3.0 - 8.6) 3.4 (1.3 - 8.7) (4.5 - 14.9) 3.1 (1.1 - 7.9) †N/A †N/A 8.0 (4.2 - 14.6) 11.0 (6.3 - 18.5) 3.0 (1.1 - 7.9) 6.5 (2.8 - 14.5) 3.2 (1.0 - 9.7) 1.8 (0.4 - 7.5) 6.0 (2.4 - 14.2) 9.1 (4.1 - 19.0) †N/A †N/A 4.7 (2.1 - 10.1) 4.8 (2.4 - 9.5) †N/A †N/A 4.7 (2.1 - 10.1) 6.1 (2.8 - 12.8) 0.8 (0.2 - 2.6) (3.0 - 6.8) 3.2 (1.9 - 5.2) 3.1 (1.4 - 6.4) 0.6 (0.2 - 1.9) 3.1 (1.9 - 5.2) 3.6 (2.3 - 5.6) 1.8 (0.6 - 5.6) 9.5 (5.7 - 15.4) 3.8 (1.9 - 7.4) 5.3 (2.9 - 9.4) †N/A †N/A 3.8 (1.9 - 7.4) 8.0 (4.9 - 12.9) 1.7 (0.5 - 6.2) 9.0 (5.0 - 15.6) 5.3 (2.3 - 11.7) 3.3 (1.1 - 9.6) †N/A †N/A 4.5 (1.8 - 10.9) 5.6 (2.8 - 10.9) 2.0 (0.5 - 7.4) Ohio 11.0 (8.2 - 14.7) 6.5 (4.3 - 9.8) 3.5 (2.1 - 5.7) 0.7 (0.3 - 1.5) 6.1 (3.9 - 9.3) 8.3 (6.1 - 11.2) 2.7 (1.6 - 4.5) Oklahoma 12.7 (7.7 - 20.3) 3.2 (1.4 - 7.1) 3.4 (1.5 - 7.5) †N/A †N/A 3.2 (1.4 - 7.1) 10.3 (5.7 - 17.7) 3.2 (1.3 - 7.4) Oregon 14.4 (9.0 - 22.2) 6.7 (3.6 - 12.1) 5.0 (1.8 - 13.2) 0.8 (0.2 - 2.9) 6.2 (3.3 - 11.6) 11.6 (6.6 - 19.6) 4.7 (1.6 - 13.1) Pennsylvania 12.4 (9.0 - 16.9) 7.1 (4.4 - 11.2) 4.5 (2.7 - 7.4) 1.1 (0.4 - 3.1) 6.8 (4.2 - 11.0) 9.5 (6.7 - 13.5) 3.1 (1.7 - 5.7) Rhode Island 17.2 (10.9 - 26.1) 7.8 (3.1 - 17.9) 8.1 (4.6 - 13.9) 4.4 (1.1 - 16.7) 7.3 (2.8 - 17.9) 15.4 (9.2 - 24.5) 5.9 (2.8 - 12.2) Massachusetts Michigan Nevada SOURCE: National Survey on Drug Use and Health, 2008–2011. †N/A denotes insufficient sample size (<4 for the numerator and <30 for the denominator) and was suppressed according to SAMHSA guidelines. Abbreviation: CI, confidence interval; MH, mental health; SA, substance abuse. 26 (1.1 - 8.8) Table 8 continued: Receipt of Mental Health and Substance Use Treatment in Past Year Among Adults Aged 18–64 Years Who are Uninsured and Have Annual Family Incomes Between 133 and 399 Percent of Federal Poverty Level, by State State Any MH Treatment % 95% CI Any Inpatient or Outpatient MH Treatment % 95% CI Any SA Treatment % 95% CI Any Inpatient MH Treatment % 95% CI Any Outpatient MH Treatment % 95% CI Any Prescription Medication for MH % 95% CI Any Specialty SA Facility Treatment % 95% CI South Carolina 10.4 (5.4 - 19.1) 5.1 (2.4 - 10.5) †N/A †N/A †N/A †N/A 5.1 (2.4 - 10.5) 9.1 (4.4 - 17.9) †N/A †N/A South Dakota 13.7 (6.8 - 25.7) 1.6 (0.7 - 3.8) 3.7 (1.3 - 10.0) †N/A †N/A 1.6 (0.7 - 3.8) 12.7 (6.0 - 24.9) 3.1 (1.0 - 9.8) Tennessee 12.0 (6.7 - 20.5) 3.4 (1.6 - 7.0) 3.3 (1.4 - 7.5) †N/A †N/A 2.4 (1.1 - 5.4) 12.0 (6.7 - 20.5) 2.6 (1.0 - 6.5) Texas 7.2 (5.3 - 9.6) 3.3 (2.3 - 4.8) 1.0 (0.5 - 1.8) 0.9 (0.4 - 1.8) 2.9 (2.0 - 4.3) 6.2 (4.4 - 8.5) 0.5 (0.2 - 1.3) Utah 13.5 (8.9 - 20.1) 7.3 (3.6 - 14.5) 4.6 (2.2 - 9.3) †N/A †N/A 7.2 (3.4 - 14.5) 9.3 (5.7 - 14.9) 3.6 (1.6 - 8.3) Vermont 12.2 (6.6 - 21.6) 7.2 (3.4 - 14.6) 1.9 (0.8 - 4.7) †N/A †N/A 7.2 (3.4 - 14.6) 8.7 (4.3 - 16.9) 1.4 (0.4 - 4.4) Virginia 16.4 (9.2 - 27.5) 6.9 (3.1 - 14.6) 8.9 (3.7 - 20.1) †N/A †N/A 6.7 (2.9 - 14.5) 13.8 (7.5 - 24.1) 8.3 (3.3 - 19.7) Washington 6.5 (3.2 - 12.8) 3.0 (1.1 - 8.0) 2.9 (1.2 - 6.7) †N/A †N/A 3.0 (1.1 - 8.0) 3.7 (1.5 - 9.3) 1.2 (0.3 - 4.1) West Virginia 13.7 (8.2 - 22.0) 6.5 (3.0 - 13.5) 1.2 (0.3 - 4.5) †N/A †N/A 6.5 (3.0 - 13.5) 11.7 (6.5 - 20.0) †N/A †N/A Wisconsin 17.8 (9.9 - 30.0) 10.0 (4.5 - 20.6) 3.3 (1.0 - 10.3) †N/A †N/A 9.4 (4.1 - 20.1) 16.4 (9.0 - 28.1) 2.3 (0.5 - 10.1) Wyoming 13.2 (9.2 - 18.5) 8.9 (5.6 - 13.9) 3.1 (1.7 - 5.5) †N/A †N/A 8.8 (5.6 - 13.8) 10.0 (7.0 - 14.2) 2.5 (1.2 - 5.0) SOURCE: National Survey on Drug Use and Health, 2008–2011. †N/A denotes insufficient sample size (<4 for the numerator and <30 for the denominator) and was suppressed according to SAMHSA guidelines. Abbreviation: CI, confidence interval; MH, mental health; SA, substance abuse. 27 Tables 9 and 10 are based on the 2011 American Community Survey and display estimates of the number of adults who meet the income criteria that would make them eligible to enroll in the Medicaid and Affordable Insurance Exchanges expansions, by insurance status. Nationally, there are approximately 18.7 million uninsured adults with incomes < 139 percent of FPL, an additional 10.1 million with employer-based health insurance, 3.3 million with non-employer based insurance, 2.0 with other public insurance, and 12.6 currently with Medicaid coverage. CMS estimates that by 2016, an additional 24 million people will be enrolled in Medicaid, the majority of whom will have been uninsured previously.11 Among the approximately 18 million adults who are currently uninsured and would become eligible for Medicaid, CMS estimates that 95 percent would enroll in Medicaid. In contrast, CMS estimates that by 2016, of the additional 24 million people who will be enrolled in Medicaid, only 2–3 million (8.3 to 12.5 percent) will have employer-sponsored health insurance and will enroll to obtain supplemental coverage through Medicaid.12 Participation rates are assumed to be higher for persons who will be eligible for Medicaid with non-group insurance. For example, the Urban Institute estimates that 85 percent of new Medicaid eligibles with non-group insurance will enroll in Medicaid.13 However, only about 3 million individuals with incomes less than 139 percent of FPL have non-group insurance. The NSDUH data indicate that the prevalence of SMI, SPD, and SUD is similar among those with incomes < 139 percent of FPL with private insurance and who are uninsured. Nationally, there are approximately 19.3 million uninsured adults with incomes between 133 and 399 percent of FPL, an additional 45 million with employer-based health insurance, 5.4 million with nonemployer based insurance, 2.9 with other public insurance, and 5.7 currently with Medicaid coverage. CMS estimates that by 2016, approximately 19 million people will be enrolled in the exchanges. Under the legislation, individuals with an offer of employment-based coverage generally will be ineligible for exchange subsidies. Thus, most individuals who receive subsidies and insurance through the exchanges will be uninsured (although the extent to which employers will stop providing insurance over the long run is a source of uncertainty and debate). 11 Centers for Medicare & Medicaid Services, Office of the Actuary, National Health Statistics Group. National Health Expenditures Projections 2010 – 2020. Available at: https://www.cms.gov/Research-Statistics-Data-and-Systems/StatisticsTrends-and-Reports/NationalHealthExpendData/downloads/proj2010.pdf. 12 Centers for Medicare & Medicaid Services. Medicaid Program; Eligibility Changes under the Affordable Care Act of 2010 (CMS-2349-F). Final Regulatory Impact Analysis. Available at: http://www.medicaid.gov/AffordableCareAct/Provisions/Downloads/MedicaidEligibilityFinalRule_Regulatory-ImpactAnalysis.pdf. 13 Holahan J., Buettgens M., Carroll C., Dorn S. The Urban Institute. The Cost and Coverage Implications of the ACA Medicaid Expansion: National and State-by-State Analysis. Kaiser Commission on Medicaid and the Uninsured. November 2012. Available at: http://www.kff.org/medicaid/upload/8384.pdf. 28 Table 9: Adults Aged 18–64 Years Who Have Annual Family Incomes < 139 Percent of Federal Poverty Level, by Insurance Status, Nationally and by State State United States Alabama Employer-based Health Insurance Direct-purchase Health Insurance Medicaid Other Public Insurance Uninsured† 10,151,024 3,331,468 12,621,579 1,974,795 18,705,110 192,035 64,817 181,722 56,266 347,467 Alaska 12,988 1,117 22,607 6,831 33,205 Arizona 188,528 62,701 381,201 38,952 434,948 Arkansas 115,728 28,921 107,363 28,535 231,245 California 1,078,984 455,956 1,708,007 186,874 2,517,590 Colorado 148,057 72,829 172,373 35,970 265,071 Connecticut 101,337 24,467 161,416 13,381 93,152 Delaware 33,413 6,476 39,286 3,913 25,146 District of Columbia 40,156 12,102 44,831 3,470 19,914 Florida 515,901 204,646 646,365 138,785 1,577,102 Georgia 386,533 94,903 292,208 85,929 872,733 Hawaii 43,424 12,369 47,830 18,900 35,669 Idaho 61,798 29,384 44,186 9,642 98,726 Illinois 390,148 130,593 526,514 66,690 672,156 Indiana 258,952 63,005 220,682 36,239 398,100 Iowa 137,978 33,437 100,590 11,008 110,895 Kansas 112,953 31,926 65,195 20,060 155,761 Kentucky 153,124 43,305 213,737 40,732 319,314 Louisiana 155,058 60,450 190,311 41,165 381,276 Maine 38,119 11,521 91,844 7,423 46,054 Maryland 156,378 46,451 173,527 23,829 184,478 Massachusetts 246,406 94,013 376,155 14,462 85,127 Michigan 348,620 98,292 541,730 43,903 527,439 Minnesota 167,314 59,894 225,727 16,135 149,609 Mississippi 124,896 27,501 150,278 28,076 264,654 Missouri 207,978 68,607 219,580 48,618 363,663 SOURCE: American Community Survey, 2011. Note: Health insurance categories are mutually exclusive, with the following hierarchy: 1) employer-based (insurance through a current or former employer or union), 2) direct-purchase (insurance purchased directly from an insurance company), 3) Medicaid, 4) other public insurance (Medicare, TRICARE or other military health, VA, and Indian Health Service). †These individuals would be eligible for the Medicaid expansion population. 29 Table 9 continued: Adults Aged 18–64 Years Who Have Annual Family Incomes < 139 Percent of Federal Poverty Level, by Insurance Status, Nationally and by State State Employer-based Health Insurance Direct-purchase Health Insurance Medicaid Other Public Insurance Uninsured† Montana 33,343 16,627 25,082 5,847 68,442 Nebraska 73,135 26,098 44,352 7,979 81,256 Nevada 92,040 18,791 60,024 20,016 211,027 New Hampshire 46,308 10,698 27,926 4,291 42,006 New Jersey 190,445 54,401 252,724 25,541 362,863 New Mexico 65,074 22,469 98,992 16,434 176,370 New York 604,743 246,890 1,219,405 72,200 730,631 North Carolina 361,767 117,239 361,173 106,891 685,664 North Dakota 29,091 14,433 13,784 4,057 24,538 Ohio 387,957 105,288 555,337 71,911 587,013 Oklahoma 133,873 35,415 122,772 38,170 314,145 Oregon 144,919 59,218 165,517 20,868 253,123 Pennsylvania 439,556 162,133 542,511 55,491 502,119 Rhode Island 39,890 20,441 44,077 6,761 41,449 South Carolina 182,704 46,702 190,283 54,001 358,217 South Dakota 29,542 10,387 21,573 5,450 38,038 Tennessee 212,524 65,535 307,943 53,869 433,575 Texas 789,048 182,711 716,666 169,750 2,319,063 Utah 98,096 35,146 65,397 8,056 149,825 Vermont 26,753 6,053 35,166 1,956 11,285 Virginia 270,954 84,706 197,835 93,174 370,603 Washington 201,412 75,293 225,308 56,625 366,946 West Virginia 66,184 18,484 95,439 21,857 132,909 Wisconsin 195,300 51,265 274,322 23,979 210,975 Wyoming 19,560 5,362 12,706 3,833 22,534 SOURCE: American Community Survey, 2011. Note: Health insurance categories are mutually exclusive, with the following hierarchy: 1) employer-based (insurance through a current or former employer or union), 2) direct-purchase (insurance purchased directly from an insurance company), 3) Medicaid, 4) other public insurance (Medicare, TRICARE or other military health, VA, and Indian Health Service). †These individuals would be eligible for the Medicaid expansion population. 30 Table 10: Adults Aged 18–64 Years Who Have Annual Family Incomes Between 133 and 399 Percent of Federal Poverty Level, by Insurance Status, Nationally and by State State United States Alabama Employer-based Health Insurance Direct-purchase Health Insurance Medicaid Other Public Insurance Uninsured† 45,003,899 5,416,326 5,727,115 2,861,812 19,272,997 775,097 105,212 62,186 67,884 244,715 Alaska 73,960 7,760 11,709 14,149 63,356 Arizona 893,827 116,326 160,660 65,873 414,300 Arkansas 463,653 54,977 52,684 41,716 214,089 California 4,640,808 697,182 843,229 222,458 2,948,753 Colorado 688,136 121,579 71,234 57,247 320,107 Connecticut 397,358 49,595 85,204 17,366 141,139 Delaware 139,973 9,587 26,547 8,053 36,434 67,280 9,268 25,167 2,244 14,838 Florida 2,523,532 379,303 311,072 203,007 1,644,960 Georgia 1,449,468 158,091 117,411 127,491 727,507 Hawaii 234,051 20,347 24,142 35,401 36,496 Idaho 268,163 47,487 18,775 18,566 103,029 Illinois 1,904,584 195,761 260,140 76,155 724,820 Indiana District of Columbia 1,144,767 93,410 96,162 49,051 384,965 Iowa 556,588 72,926 46,782 14,980 110,986 Kansas 480,564 65,568 28,009 34,150 144,679 Kentucky 721,602 74,022 71,647 62,727 234,748 Louisiana 615,032 83,625 80,905 52,219 318,083 Maine 210,917 23,133 37,988 12,608 68,862 Maryland 725,068 92,249 105,926 42,758 252,507 Massachusetts Michigan Minnesota Mississippi Missouri 855,803 107,026 265,575 23,712 125,116 1,633,006 179,665 203,919 63,942 484,692 848,900 120,320 101,267 30,645 195,903 462,799 53,390 56,061 44,715 188,299 1,009,040 116,462 81,740 68,600 319,621 SOURCE: American Community Survey, 2011. Note: Health insurance categories are mutually exclusive, with the following hierarchy: 1) employer-based (insurance through a current or former employer or union), 2) direct-purchase (insurance purchased directly from an insurance company), 3) Medicaid, 4) other public insurance (Medicare, TRICARE or other military health, VA, and Indian Health Service). †These individual are eligible for subsidies and may enroll in the Affordable Insurance Exchanges. 31 Table 10 continued: Adults Aged 18–64 Years Who Have Annual Family Incomes Between 133 and 399 Percent of Federal Poverty Level, by Insurance Status, Nationally and by State State Employer-based Health Insurance Direct-purchase Health Insurance Medicaid Other Public Insurance Uninsured† Montana 151,707 26,158 9,765 13,126 76,840 Nebraska 309,563 52,358 16,577 21,620 89,621 Nevada 459,537 38,031 35,062 28,630 234,424 New Hampshire 196,548 18,174 14,598 11,603 61,073 1,030,580 102,481 141,134 40,214 505,571 265,661 31,835 45,485 25,060 164,622 New York 2,545,399 255,531 633,056 100,503 984,185 North Carolina 1,446,864 196,046 137,488 160,042 625,217 103,999 22,695 6,402 5,283 26,066 New Jersey New Mexico North Dakota Ohio 1,996,156 186,097 161,044 97,025 564,194 Oklahoma 583,054 57,261 47,779 54,294 249,504 Oregon 586,543 93,626 58,080 27,537 256,909 Pennsylvania 2,079,428 248,513 224,175 75,734 546,597 Rhode Island 155,719 14,042 19,233 5,582 50,369 South Carolina 747,340 73,538 67,519 84,785 293,792 South Dakota 128,463 28,225 5,528 13,167 36,873 Tennessee 1,055,603 128,077 113,423 80,737 392,675 Texas 3,338,654 326,972 348,716 247,319 2,283,862 520,466 56,626 27,268 14,574 149,296 Utah Vermont 98,849 9,100 25,883 4,722 23,550 1,111,304 127,488 71,428 135,053 416,151 Washington 948,180 134,335 93,835 89,608 408,469 West Virginia 302,948 17,007 35,418 24,315 115,556 Wisconsin 977,934 105,516 137,077 35,416 218,051 Wyoming 79,424 12,323 5,001 8,146 36,526 Virginia SOURCE: American Community Survey, 2011. Note: Health insurance categories are mutually exclusive, with the following hierarchy: 1) employer-based (insurance through a current or former employer or union), 2) direct-purchase (insurance purchased directly from an insurance company), 3) Medicaid, 4) other public insurance (Medicare, TRICARE or other military health, VA, and Indian Health Service). †These individual are eligible for subsidies and may enroll in the Affordable Insurance Exchanges. 32 Methods for Estimating Behavioral Health Service Need and Use V. This section describes methods that states can employ to generate prevalence and utilization estimates to support planning efforts. An overview of the National Survey on Drug Use and Health (NSDUH) is provided, as well as step-by-step instructions on how to access the data. In addition, information on how to access and use the American Community Survey is also provided. National Survey of Drug Use and Health Data as a Resource for System Planning The National Survey of Drug Use and Health (NSDUH) is a unique data source for determining the prevalence of behavioral health conditions and use of behavioral health services. NSDUH is sponsored by the Substance Abuse and Mental Health Services Administration (SAMHSA), in the U.S. Department of Health and Human Services. NSDUH collects information from residents of households and noninstitutional group quarters (e.g., shelters, rooming houses, dormitories) and from civilians living on military bases. The survey excludes homeless persons who do not live in shelters, military personnel on active duty, and residents of institutional group quarters such as jails and hospitals. NSDUH employs a state-based design with an independent, multistage area probability sample within each state and the District of Columbia, which allows for state-level estimates. Approximately 70,000 interviews are completed each year. The survey collects data by administering questionnaires to a representative sample of the population through face-to-face interviews at the respondent's place of residence. For more information on the NSDUH see http://www.samhsa.gov/data/NSDUH.aspx. Measures of Behavioral Health Need Estimates of the prevalence of behavioral health conditions within a state can provide an important baseline for planning efforts. Three measures that may be useful, in particular, are the prevalence of: Serious mental illness Serious psychological distress Substance use disorder These measures are described briefly below. Serious Mental Illness: Respondents to the NSDUH meet the criteria for SMI in the past year if they have had a diagnosable mental, behavioral, or emotional disorder (excluding developmental and substance use disorders) of sufficient duration to meet diagnostic criteria specified within the 4th edition of the Diagnostic and Statistical Manual of Mental Disorders (DSM-IV) that has resulted in serious functional impairment that substantially interferes with or limits one or more major life activities. Adult NSDUH respondents' mental illness is determined based on modeling their responses to questions on distress (Kessler-6 [K6] scale) and impairment (truncated version of the World Health Organization Disability Assessment Schedule [WHODAS]).14 14 Beginning in 2008, this indicator is based on both distress and impairment and is not comparable with SMI variables prior to 2008, when SMI was only based on distress. Recoded variables were defined from these items to measure psychological distress and SMI as well as suicide ideation in the past year. These variables include total scores from the psychological distress and impairment scales, the predicted probability of SMI, and indicators of various levels of mental illness. 33 Serious Psychological Distress: Respondents are determined to have SPD if they have a score of 13 or higher on the Kessler-6 (K6) scale. The Kessler-6 (K6) scale consists of six questions that gather information on how frequently adult respondents experienced symptoms of psychological distress during the past month or during the one month in the past year when they were at their worst emotionally. These questions ask about the frequency of feeling (1) nervous, (2) hopeless, (3) restless or fidgety, (4) sad or depressed, (5) that everything was an effort, and (6) no good or worthless. The NSDUH measure of serious psychological distress results in larger prevalence estimates than the SMI.15 Substance Use Disorder: An adult is defined as having a SUD if they meet the criteria for abuse or dependence for illicit drugs or alcohol. Abuse of illicit drugs or alcohol is defined as meeting one or more of the four criteria for abuse included in the DSM-IV. Dependence on illicit drugs or alcohol is defined as meeting three out of seven dependence criteria (for substances that included questions to measure a withdrawal criterion) or three out of six dependence criteria (for substances that did not include withdrawal questions) for that substance, based on criteria included in DSM-IV. Additional criteria for alcohol and marijuana dependence since 2000 included the use of these substances on 6 or more days in the past 12 months. Measures of Behavioral Health Service Use As noted above, behavioral health condition prevalence rates provide an important starting point for understanding a population’s potential need for treatment. However, many individuals with a diagnosable mental or substance use condition will never seek treatment.16 Furthermore, many individuals without a diagnosable mental or substance use condition, such as those whose conditions are in remission or are asymptomatic, may still need maintenance treatment to remain well. The NSDUH includes a number of measures of behavioral health utilization that can be helpful in projecting behavioral health services utilization under new programs. For example, among the types of services captured on the NSDUH are the following measures: Receipt of any mental health treatment Receipt of any inpatient mental health treatment Receipt of any outpatient mental health treatment Receipt of any treatment at any location for illicit drug or alcohol use Receipt of any prescription medication for mental health treatment Receipt of substance use (illicit drug or alcohol) treatment at a specialty facility Other more specific types of utilization measures are also available, such as receipt of treatment at an inpatient rehabilitation facility and doctor’s office. It should be noted, however, that the NSDUH sample sizes may be too small to accurately estimate the number of persons using some specific types of services at the state level, even after pooling multiple years of survey data. 15 The measure of serious psychological distress is based on the K6 scale. For a description and properties of the K6 scale, see Kessler RC, Barker PR, Colpe LJ, et al., Screening for serious mental illness in the general population. Archives of General Psychiatry 2003;60(2):184–189. 16 Substance Abuse and Mental Health Services Agency. Results from the 2010 National Survey on Drug Use and Health: Mental Health Findings. NSDUH Series H-42, HHS Publication No. (SMA) 11-4667. Rockville, MD: Substance Abuse and Mental Health Services Administration, 2012. Available at: http://www.samhsa.gov/data/NSDUH/2k10MH_Findings/2k10MHResults.pdf. 34 In the next section, we present step-by-step instructions for generating state- or county-level behavioral health prevalence and service use estimates using the NSDUH to inform decisions about system planning. Instructions for Using the NSDUH (R-DAS) to Estimate Behavioral Health Prevalence and Service Use To determine the prevalence of behavioral health conditions and current behavioral health services utilization among populations that could be eligible for new programs and insurance expansions, a starting point is to analyze the NSDUH data using the Substance Abuse and Mental Health Data Archive (SAMHDA) Restricted-Use Data Analysis System (R-DAS). The R-DAS allows researchers to produce custom frequencies and crosstabs of state-level data using restricted-use data files. All output is considered public use, and any data that do not meet disclosure limitations are automatically suppressed. The R-DAS for NSDUH data is available at: http://www.icpsr.umich.edu/icpsrweb/content/SAMHDA/rdas.html. States can develop prevalence and utilization estimates using the following steps: 1. Log on to the R-DAS website using an account from MyData, Google, or Facebook. Create a MyData account by going to the R-DAS website (http://www.icpsr.umich.edu/icpsrweb/content/SAMHDA/rdas.html) and then click on “Create a new MyData account.” Fill out all fields in the form and click “Submit.” 2. Once your account information has been submitted, stay on the current webpage. Go to the top of the current web page and hover your mouse icon over the red tab “Analyze Online.” Scroll down and then click on “Analyze Online with R-DAS.” 3. Several data files are currently available for analysis, including 8-year (2002–2009), 4-year (2002–2005, 2006–2009), or 2-year files (2002–2003, 2004–2005, 2006–2007, 2008–2009, 2010–2011). Select the file of interest by clicking on the appropriate folder. Carefully review the documentation for the data file of interest, including the study scope, description, and methodology, documentation on producing correct estimates, and codebook. We also recommend that you review the variable crosswalk. 4. Once you have determined which data file to use,17 click on the data file name. A menu will unfold that displays “Online Analysis: R-DAS.” Click on “R-DAS.” For the purpose of this demonstration, we selected the NSDUH 2-year R-DAS Files. 5. The login page will be displayed. Click on “ICPSR MyData.” Enter the email address and password you used to setup your MyData account. Then, click the “Log In” button. 17 Determination of which R-DAS file is most appropriate is based on the user’s analytic needs. For example, the 2-year file may provide insufficient sample sizes; therefore, users may need to use the 4- or 8-year files. R-DAS files may contain different variables based on the availability and consistency of variables across years covered. In addition, not all variables from the full restricted-use data files are included in R-DAS. 35 6. The Terms of Use page will be displayed. Carefully review the Terms of Use and select “I Agree” at the bottom of the page. You will then be taken to the NSDUH 2-Year R-DAS online analysis web page. 7. Once you are on the NSDUH 2-Year R-DAS analysis web page, review the documentation at the bottom of the page, including FAQs on R-DAS, Study Home Page, and the information available on Getting Started and Recoding Variables. 8. In the ROW box, enter the variable for the behavioral health condition or service of interest. Note that the presence of condition is indicated by variable name(1). Each variable must be entered in the ROW box as a separate data run. a. b. c. d. e. f. g. h. i. Serious mental illness: SMIYR18 Serious psychological distress: SPDYAJ_B19 Substance use disorder: ABODILAL Receipt of any mental health treatment: AMHTXRC3 Receipt of any inpatient mental health treatment: AMHINP2 Receipt of any outpatient mental health treatment: AMHOUTP3 Receipt of any treatment at any location for illicit drug or alcohol use: TXILLALC Receipt of any prescription medication for mental health treatment: AMHRX2 Receipt of substance use (illicit drug or alcohol) treatment at a specialty facility: SPILLAC 9. In the COLUMN box, enter STATE. If the entire table is suppressed because one or more cells in the table have too few cases, restrict the analysis to only the state(s) of interest using the SELECTION FILTER box (see below). 10. In the CONTROL box, enter populations you wish to compare. A separate table is produced for each category of a CONTROL variable. The variable POVERTY2 will enable comparison between the following predetermined poverty classifications: (1) <100% of federal poverty threshold, (2) 100-199% of federal poverty threshold, (3) >=200% of federal poverty threshold. An alternative option is to use the continuous variable POVPER to classify into specific categories as appropriate. For example, to recode as <139% of federal poverty threshold enter, POVPER(r: 0138 "<139"). Note that it if the poverty classifications have overlapping values, such as the values presented in this Toolkit (<138% and 133-399%), the system will automatically place the overlapping cases in only the first category; thus, separate data runs must be completed for each poverty classification. 11. In the SELECTION FILTER box, enter multiple filters as appropriate for your analysis. For example, you can restrict the analysis to individuals who are aged 18–64 years and uninsured: AGE(18–64), IRINSUR(2). It is also necessary to include the year pair indicator, as a filter variable, to generate appropriately weighted results.20 For example, the 2-year 2008–2009 file 18 The variable for SMI (SMIYR) is relatively new and is based on responses to questions from standard instruments that measure the individuals’ symptoms and functioning. As a result of the changes in coding, if you are conducting this analysis in R-DAS, it is only possible to use the 2008–2009 or 2010–2011 2-year file for estimates using this definition of SMI. The Center for Behavioral Health Statistics and Quality (CBHSQ) will be updating the SMI variable in late 2013. The revised variable will be SMI_U. The revised variable should be used once it is available. 19 Note: this variable is available only in the later 2- and 4-year R-DAS files. 20 Inter-University Consortium for Political and Social Research. Institute for Social Research, University of Michigan. Available at: http://www.icpsr.umich.edu/icpsrweb/SAMHDA/studies/34482/datasets/1/sda/variable?var=YRPRIND&sda_id=18235. 36 is indicated by YRPRIND(4). Lastly, if you are restricting the analysis to particular state(s), enter STATE, with the FIPS code(s) of interest in parentheses, separated by commas. 12. The “Column” box will already be checked. Click “Run the Table.” 13. A results screen will appear with the prevalence estimates. On the left side of the results screen, under “Revise the Display,” you may make modifications to the way in which the output is displayed. We recommend selecting to display 95 percent confidence intervals by checking the appropriate box. After making any modifications to the display, click “Revise Display.” Note that any data that do not meet disclosure limitations will be suppressed automatically. Additional Notes on Using the R-DAS Several data options are available for analysis, including 8-year (2002–2009), 4-year (2002–2005, 2006– 2009), or 2-year files (2002–2003, 2004–2005, 2006–2007, 2008–2009, 2010–2011). Determination of which R-DAS file is most appropriate should be based on the user’s analytic needs. For example, the 2year file may provide insufficient sample sizes; therefore, users may need to use the 4- or 8-year files. Additionally, users must determine what variables they require and in which years they are available. In all analyses using the 2- and 4-year files, the variable indicating the years of data should be used either as a variable in the table or as a filter variable used to subset the data file. Users should not combine multiple years of data because the weights have been developed for the specific year combinations on the files. Users should carefully review the coding manual and documentation to determine whether their analyses can be supported and any use limitations. To reflect the uncertainty in the prevalence estimates, all results should be presented with confidence intervals. It should be noted that, in some instances, the cell sizes may be so small that the results will be suppressed automatically. Because relatively small NSDUH samples form the basis of the behavioral health prevalence estimates for some states, you may need to include multiple data years to generate accurate estimates. If you have any questions, please contact the SAMHDA Help Desk via telephone (888-741-7242) or email (samhda-support@icpsr.umich.edu). Instructions for Using the NSDUH Data Portal to Estimate Behavioral Health Prevalence and Service Use There are limitations to the types of analyses that the R-DAS, as currently designed, can support. For example, the first release will not support regressions or sub-state estimates. Moreover, some years or variables may not be available. In order to further expand access to NSDUH restricted-use data, SAMHSA has also developed a Data Portal. The Data Portal provides authorized researchers with secure virtual access to confidential data via a virtual desktop for approved research projects. The data remain in a central repository and cannot be locally downloaded, copied, or saved. Further, all output have to undergo disclosure analysis before the researcher can remove them from the system. Currently, 2004 to 2011 NSDUH are available. The Data Portal includes SAS (SAS Institute; Cary, NC), SPSS (IBM Corp; Somers, NY), Stata, Microsoft® Office, and other software for analysis, but there is no query system provided, thus users will need to be 37 facile with one of these statistical software packages. The Data Portal access requires completion of an application process and is subject to project approval. Analysts interested in applying for access to the Data Portal should carefully review the application materials available at www.icpsr.umich.edu/icpsrweb/content/SAMHDA/dataportal.html. As part of the application process, applicants must determine what variables are needed for the proposed project. Much of the information on variables is available through the codebooks for the public-use files. The combined examination of the public-use data codebook with complete frequency distributions, and the questionnaires, may help analysts decide whether the public-use file meets their research purposes or whether the restricted-use NSDUH confidential data are needed. Additional information on the variables available through the data portal is available at http://www.icpsr.umich.edu/icpsrweb/content/SAMHDA/dataportal.html. States can also contact the Center for Behavioral Health Statistics and Quality (CBHSQ) at http://www.samhsa.gov/data/data_request.aspx for more information on approximate sample sizes (exact sample sizes are confidential). For each research project, the organization(s) must complete and submit the Application for Access to Confidential Data. The Application must clearly outline the nature of the proposed research project, as well as the specific information and categories of variables needed and how this information will be used. Only the data requested in the application and approved as part of the signed Agreement will be provided for use in the Data Portal. Any additional data must be requested and approved through a formal, signed amendment to the Agreement. After the application is approved, CBHSQ, the Principal Project Officer, and the Receiving Organization Representative must sign the Confidential Data Use and Nondisclosure Agreement. Then each research team member must complete confidentiality training and sign a notarized Designation of Agent and Affidavit of Nondisclosure form agreeing to abide by Confidential Information Protection and Statistical Efficiency Act (CIPSEA) requirements and the Confidential Data Use and Nondisclosure Agreement. Additional information about the NSDUH Data Portal, including the application materials, is available at www.icpsr.umich.edu/icpsrweb/content/SAMHDA/dataportal.html. Instructions for Using the American Community Survey to Estimate the Number of People Who Will Enroll in Insurance Expansions The NSDUH can provide states with information on the percentage of a given population with a behavioral health disorder and the percentage that use particular behavioral health services. The NSDUH also includes population counts (based on population weights) that can be used to project the numbers of individuals who will need and use services. However, states may want to consider whether to obtain the population count information from an alternative source and limit use of the NSDUH to generating the population proportions. In particular, the American Community Survey (ACS) is a frequently used source for estimates of the number of individuals who would become eligible under the Affordable Care Act Medicaid expansion and Affordable Insurance Exchanges. The 2011 ACS included interviews with 2.1 million people living in households and 148,500 people living in group quarters (versus about 280,000 interviewed over the four years of NSDUH data). Because the number of interviews in the ACS is much larger than the number from the NSDUH, the counts of the uninsured will be stronger when using the ACS, particularly in the 38 smallest states.21 The ACS also includes county-level data for states interested in generating countylevel counts. Information above on the prevalence and likely use of behavioral health services from the NSDUH can be applied to estimates of the number of people who are likely to enroll in particular programs or insurance expansions, such as under the Medicaid expansion and Affordable Insurance Exchanges in each state or by county. There are two methods to access the ACS data, which are detailed below. 1. The Public Use Microdata Samples (PUMS) ACS data can be downloaded directly in SAS® or CSV format from: http://www.census.gov/acs/www/data_documentation/2011_release/. Once you have downloaded the data, use similar criteria and assumptions to identify the population(s) of interest as above in the NSDUH (e.g., adults aged 18–64 years who are uninsured and have incomes less than 139 percent of FPL and adults aged 18–64 years who are uninsured and have incomes between and including 133 percent and 399 percent of FPL, respectively). First, restrict the population to the age group of interest. Next, FPL can be determined by the ACS poverty status recode variable (POVPIP), which is based on annual income as reported on the survey and measures the percent of poverty threshold. Then, identify uninsured individuals on the ACS using the Insured/Any Health Insurance Coverage Status variable (HICOV=2). If you are interested in obtaining information on subcategories of the insured (HICOV=1), additional information is available using the variables HINS1–HINS7. Please note that it is necessary to deduplicate using the following (or alternative) hierarchy: (1) insurance through a current or former employer or union (HINS1=1); (2) insurance purchased directly from an insurance company (HINS2=1); (3) Medicaid (HINS4=1); (4) other public insurance: Medicare, TRICARE or other military health, Veterans Affairs (VA), and Indian Health Service (HINS3=1 or HINS5=1 or HINS6=1 or HINS7=1). Note that the ACS PUMS is a weighted sample, and weighting variables must be used to generate accurate estimates and standard errors. The PUMS file includes both population weights and household weights. Population weights (PWGTP) should be used to generate statistics about individuals. 2. An alternative mechanism to access the ACS data is via the U.S. Census Bureau American FactFinder. From the American FactFinder homepage (http://factfinder2.census.gov), click on the “Advanced Search” tab on the top of the page. On the left side of the screen, click the “Topics” icon to expand. Then, click “Databases” at the bottom and select the American Community Survey dataset of interest to add it to the search options. For the purpose of this example, we selected the 2011 ACS 1-year estimates. Next, click on “People” at the top of the “Select Topics” box to expand the selection criteria. Expand the “Insurance Coverage” option and select “Health Insurance.” Expand the “Age & Sex” option and select “Age.” Expand the “Poverty” option and select “Poverty.” Close the “Select Topics” box. On the left side of the screen, click the “Geographies” icon to expand and use the drop down menu to select the geographic level of analysis (e.g., United States, state, county). Then, highlight the geographic areas of interest and click “Add to Your Selections.” Tables with the data of interest will appear under the search results. For the purpose of this example, we select the link to “Health Insurance Coverage Status and Type by Ratio of Income to Poverty Level in the Past 12 Months 21 Additional information and data from the ACS are available at the CMS website on Census Data to Target the Uninsured. http://cms.gov/Outreach-and-Education/Outreach/HIMarketplace/Census-Data-.html?no_redirect=true. 39 by Age.” Note that the age, poverty, and health insurance categories are predetermined and recoding is not possible. Depending on your poverty range of interest, you may need to add estimates of poverty categories for adults aged 18–64 years. Also note that if you select the link to “Health Insurance Coverage Status and Type by Ratio of Income to Poverty Level in the Past 12 Months by Age,” the health insurance coverage subcategories (e.g., employer-based health insurance, direct-purchase health insurance, Medicare coverage, and Medicaid/means-tested public insurance) are not mutually exclusive and, therefore, sum to more than the total population with health insurance coverage. As a result, if you are interested in population estimates for these populations, we recommend that you follow step 1 above. 3. To estimate the number of individuals, multiply the prevalence rate of behavioral health condition or percentage of behavioral health service of interest from the NSDUH by the number of individuals in the ACS who are eligible for the Medicaid expansion and Affordable Insurance Exchanges (or other population of interest). 4. Analysts then may want to make adjustments to the estimates to take into account “take-up rates” and elasticity of demand22 with respect to insurance coverage. Key Considerations In this section, we discuss some other considerations that states may wish to consider in using the NSDUH data for service planning. Defining Eligibility: The first step in determining the behavioral health needs and projected utilization rates of a particular population that will enroll in a new program or insurance expansion is to define the eligibility criteria of that program. As discussed below, two commonly used eligibility criteria in program and insurance expansions are income and age. Income: The eligibility for the new Affordable Care Act insurance expansions is primarily determined by a person’s federal poverty level (FPL), which takes into account their state of residence, family income, and family size. FPL varies depending on family size and by state; thus, one should consider these factors in assigning the U.S. Department of Health and Human Services guideline values to particular individuals in the survey.23 Age: Analysts may wish to consider the behavioral health treatment needs for children and adult separately because children and adults typically differ in: (1) types of mental health and substance use conditions, (2) the measures available for identifying behavioral health needs, and (3) available insurance programs. In particular, many low-income children are eligible for and enrolled in the Children’s Health Insurance Program (CHIP). Finally, it is important to note that the NSDUH does not include children younger than 12 years, and not all behavioral health measures are available for children aged 12 to 17 years. Take-up Rates: Projections of the number of individuals in newly established programs must take into account the fact that not everyone who is eligible for a public or private insurance program will enroll. 22 Elasticity of demand is the degree to which demand for a good or service is a function of change in price. Office of the Assistant Secretary for Planning and Evaluation. Prior HHS Poverty Guidelines and Federal Register References. Available at: http://aspe.hhs.gov/poverty/figures-fed-reg.cfm. 23 40 The take-up rate is the percentage of those who are eligible for a particular program and actually enroll in that program. In terms of the Medicaid expansion, CMS assumed that states will facilitate enrollment in the Medicaid expansion and that ultimate participation rates in the Medicaid expansion would be achieved in 2015, with 80 percent of the ultimate rate achieved in 2013 and 90 percent achieved in 2014.24 In contrast, the Congressional Budget Office estimated that 57 percent of uninsured people who gain Medicaid eligibility will enroll in the program nationally, whereas a 75 percent take-up rate was used by the Urban Institute.25,26,27 28 The Effect of Insurance Coverage on Utilization Rates: In projecting utilization rates under a new program, states must be aware that current behavioral health use rates may change once a population gains insurance coverage. A large body of research finds that once people move from being uninsured to insured, they use more medical care and incur higher medical care costs. The extent of the increase is often called elasticity of demand or an induction factor. Estimating the exact amount by which use will increase once people become insured is equal parts “art” and “science.” Given the uncertainty around the exact amount of increase, we suggest that policymakers use a range of estimates. A reasonable baseline estimate, which has been cited by CMS in their recent regulatory impact analysis, comes from the expansion of Oregon’s Medicaid program.29 In 2008, Oregon conducted a lottery to expand access to uninsured adults with incomes below 100 percent of FPL. Approximately 10,000 randomly selected low-income adults were newly enrolled in Medicaid. The evaluation is particularly strong because it was able to compare outcomes for those who won the lottery with outcomes for those who applied but did not win, and it contains an estimate of the benefits of Medicaid coverage. Evaluators found that Medicaid coverage increases the probability of using outpatient care by 35 percent, of using prescription drugs by 15 percent, and of hospital admissions by 30 percent.30 Overall, they estimate that the increased health care use from enrollment in Medicaid translates into about a 25-percent increase in total annual health care expenditures. Although these estimates are useful as baseline assumptions, utilization rates for particular behavioral health services and providers may differ from the overall medical care utilization rates, and the rates will be influenced by the types of insurance benefits offered. 24 Centers for Medicaid & Medicare Services. Offices of the Actuary. Estimated Financial Effects of the “America’s Affordable Health Choices Act of 2009” (H.R. 3200), as Reported by the Ways and Means Committee. October 21, 2009. Available at: http://www.cms.gov/Research-Statistics-Data-and-Systems/Research/ActuarialStudies/Downloads/HR3200_2009-10-21.pdf 25 Elmendorf DW. Congressional Budget Office, letter to Speaker Pelosi. March 20, 2010. Table 4. Available at: http://www.cbo.gov/sites/default/files/cbofiles/ftpdocs/113xx/doc11379/amendreconprop.pdf. 26 Holahan J, Headen I. Medicaid Coverage and Spending in Health Reform: National and State-by State Results for Adults at or Below 133 percent FPL. The Henry J. Kaiser Family Foundation, May 2010. Available at: http://obamacarefacts.com/obamacaredocs/medicaid-expansion-kkf.pdf. 27 Holahan J, Buettgens M, Carroll C, Dorn S, The Urban Institute. The Cost and Coverage Implications of the ACA Medicaid Expansion: National and State-by-State Analysis. November, 2012. Available at: www.kff.org/medicaid/upload/8384.pdf. 28 Buettgens M, Bovbjerg RR, Carroll C, Moody Habib. The ACA Medicaid Expansion in Washington. May 2012. Available at: http://www.urban.org/UploadedPDF/412581-The-ACA-Medicaid-Expansion-in-Washington.pdf. 29 Centers for Medicare & Medicaid Services. Medicaid Program; Eligibility Changes under the Affordable Care Act of 2010. (CMS-2349-F) Final Regulatory Impact Analysis. March 2012. Available at: http://www.medicaid.gov/AffordableCareAct/downloads/CMS-2349-F-RegulatoryImpactAnalysis.pdf. 30 Finkelstein A, Taubman S, Wright B, et al. The Oregon Health Insurance Experiment: Evidence from the First Year. National Bureau of Economic Research Working Paper No. 17190, July 2011. Available at: http://www.nber.org/papers/w17190. 41 Methods for Estimating County-Level Behavioral Health Service Need and Use VI. For large states and states that organize their behavioral health systems within county governments, determining the need for and use of mental health and substance abuse services at the county level may be particularly important. For example, California consists of 58 counties with considerable variation in structure and capacity from one county to another. Thus, insurance expansions may have very different implications for service planning in different counties. At this time, however, the availability of accurate county-level prevalence and utilization estimates is limited by the relatively small samples sizes captured in national surveys of behavioral health, such as the NSDUH.31 In addition, although one can create synthetic estimates by projecting state-level estimates to counties by adjusting for demographic differences, the accuracy of the resulting estimates cannot be determined and may be poor. Thus, to develop county-level estimates, we recommend that states use state-level utilization data for the particular sub-population of interest and assume that the utilization rates apply to the population within the county. The following is an example of the development of county-level estimates for enrollment in the Medicaid Expansion under the Affordable Care Act in 2014, using Alameda County, California: 1. 2. 3. 4. 5. 6. 31 Use the 2011 American Community Survey to determine that in Alameda County, California there are approximately 201,203 individuals aged 18–64 years who are less than 139 percent of FPL, of which 69,128 are uninsured. Assume that 95 percent of those who are uninsured and eligible will enroll: 65,672. Determine the prevalence rates. According to the state-level NSDUH estimates for California, the prevalence rate for SMI, SPD, and SUD among adults aged 18–64 years who are uninsured and have annual family incomes less than 139 percent of FPL is approximately 5.0 (CI: 3.7 – 6.6), 11.2 (CI: 9.0 – 13.7) and 9.7 (CI: 7.7 – 12.1) percent, respectively. Assume that the majority of enrollees will be uninsured; thus, multiply 65,672 by the prevalence rates to determine the number of people with SMI, SPD, and SUD in Alameda County who are likely to enroll in the Medicaid Expansion. Note that although the prevalence rates are not the same as utilization rates, they may be useful as an indicator of “need” and potentially “unmet need”: o SMI: 5.0% x 65,672 = 3,284 o SPD: 11.2% x 65,672 = 7,355 o SUD: 9.7% x 65,672 = 6,370 Next, examine current utilization rates among the same population. According to the NSDUH estimates, the utilization rates for mental health services among adults aged 18–64 years who are uninsured and have annual family incomes less than 139 percent of FPL are: o Any mental health (MH) treatment use: 4.3% (CI: 3.0 – 6.1) o Any inpatient MH treatment: 0.5% (CI: 0.2 – 1.4) o Any outpatient MH treatment: 2.5% (CI: 1.6 – 4.1) o Any prescription for MH medication: 2.7% (CI: 1.8 – 4.2) Calculate the number of individuals who are newly enrolled and who may use mental health services in Alameda County, California during the course of a year: o Any MH treatment: 4.3% x 65,672 = 2,824 SAMHSA is currently evaluating the feasibility of releasing a county-level R-DAS for large counties. 42 o o o Any inpatient MH treatment: 0.5% x 65,672 = 328 Any outpatient MH treatment: 2.5% x 65,672 = 1,642 Any prescription for MH medication: 2.7% x 65,672 = 1,773 7. Adjust the utilization rates by assuming any induction factors. As described above, a reasonable assumption is that once people become insured, the probability of hospital admission will increase by 30 percent, of using outpatient care by 35 percent, and of using prescription drugs by 15 percent.32 We assume that any mental health care will increase by 25 percent, based on the data reviewed above showing that overall costs increased by 25 percent and because it is in between the low and high increases among various MH services. A range of estimates can be created by using alternative assumptions. 8. Recalculate the number of individuals who are newly enrolled and who may use mental health services in Alameda County, California during the course of a year using the induction factor: o Any MH treatment: 1.25 x 2,824 = 3,530 o Any inpatient MH treatment: 1.30 x 328 = 427 o Any outpatient MH treatment: 1.35 x 1,642 = 2,216 o Any prescription for MH medication: 1.15 x 1,773 = 2,039 9. Calculate the increase in mental health service use during the course of a year (Step 8 minus Step 6): o Any MH treatment: 706 o Any inpatient MH treatment: 99 o Any outpatient MH treatment: 574 o Any prescription for MH medication: 266 VII. Conclusion This Behavioral Health Treatment Needs Assessment Toolkit provides guidance on how states and other payers can address key questions regarding the expected level of need for and use of behavioral health services that might be offered to newly eligible populations. The Toolkit provides readily available estimates of the prevalence of behavioral health disorders and use of behavioral health services among populations who are likely to be eligible for insurance or other waiver expansion. The Toolkit also describes how users can access and analyze the NSDUH to obtain additional or more tailored information on behavioral health needs by particular sub-populations within states, income groups, insurance status groups, and age groups. Also discussed are factors that need to be considered in generating estimates, such as how gaining insurance may influence utilization rates and assumptions about participation rates. 32 Finkelstein A, Taubman S, Wright B, et al. The Oregon Health Insurance Experiment: Evidence from the First Year. National Bureau of Economic Research Working Paper No. 17190, July 2011. Available at: http://www.nber.org/papers/w17190. 43 Authors Truven Health Analytics Tami Mark, Ph.D. Lauren Wier, M.P.H. Andriana Hohlbauch, M.P.H. John Easterday, Ph.D. Human Services Research Institute David Hughes, Ph.D. Technical Assistance Collaborative Steve Day RTI International Michael Penne, M.P.H. Alexander Cowell, Ph.D. Substance Abuse and Mental Health Services Administration Kevin Malone Suzanne Fields, MSW, LICSW Reviewers Substance Abuse and Mental Health Services Administration Jonaki Bose National Academy for State Health Policy (NASHP) Neva Kaye Sonya Schwartz, M.S. 44 SAMHSA’s mission is to reduce the impact of substance abuse and mental illness on America's communities HHS Publication No. SMA 13-4757 Printed 2013


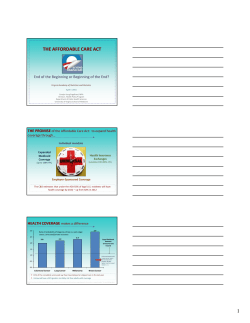


© Copyright 2025