Developing Viral Hepatitis Screening and Prevention Services for
Developing Viral Hepatitis
Screening and Prevention Services for
American Indians and Alaska Natives at an
Urban Chemical Dependency Treatment Facility
Ms. Shelly Huffman MPH
VHIP Health Educator
Seattle Indian Health Board
Mei Lin Castor MD, MPH
Medical Epidemiologist
Urban Indian Health Institute
Seattle Indian Health Board
M. Castor, M. Taualii, A. Anderson,
S. Huffman, A. Park, C. Town,
J. Redd, and R. Forquera
2
Geographic Distribution of the
AI/AN Population
Urban Areas
61%
Rural Areas
39%
Total AI/AN Population = 4.1 million
Percentage of Total U.S. Population = 1.5%
Source: U.S. Census Bureau, 2000
Note: AI/AN mixed race
3
Challenges in Describing Urban AI/AN
• Lack of data
9No inclusion of urban AI/AN in Indian
Health Service statistics
9Non-existent public health surveillance
system for urban AI/AN
• Poor data quality
9Incomplete data
9Inaccurate data due to errors of racial
misclassification; results in consistent
underestimates for AI/AN
4
Seattle Indian Health Board
• Private, non-profit 501(c)(3)
• Community Health Center
• Founded in 1970
• Governed by 15-member Board of Directors
• Important safety-net healthcare provider in community
Pearl Warren
Administration
Human Resources
Fiscal
Leschi Clinic
Primary Medical Care
Dental Care
WIC/Nutrition
Mental Health
Pharmacy
Outpatient Chemical Dependency
Domestic Violence
Community Services
Urban Indian
Health Institute
Research/Epidemiology
Programmatic Activities
Service to 34 urban Indian
health organizations
nationwide
Thunderbird Treatment Center
Residential Chemical Dependency Treatment
Satellite Medical Services
6
Thunderbird Treatment Center
• Residential chemical dependency treatment
facility
• Inpatient Treatment: intensive (28 days),
recovery (60 days), or long-term (6 months)
• Serves 500-600 clients/year
• Target population
– AI/AN living in Seattle
King County region
– Adults > 18 years
7
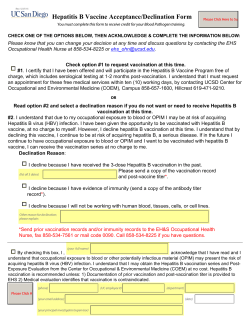
Viral Hepatitis Integration Project at
Thunderbird Treatment Center
• Fifth year of existence
• Provides hepatitis screening/prevention services
• Multiple project stakeholders
– Thunderbird Treatment Center houses project
– Urban Indian Health Institute (UIHI) processes
data
– Leschi Clinic and UIHI administers project
• Project evolution over time
– Recent dedicated staff person
8
VHIP Goal and Objectives
• Goal: To reduce incidence of viral hepatitis among
patient population
• Objectives
9 Screen for related risk behaviors
9 Provide education and counseling
9 Provide hepatitis C laboratory testing
9 Provide hepatitis A and B vaccinations
9 Integrate above with patients’ treatment programs
9 Collect information for epidemiology and quality
improvement
9 Develop tools for expansion
9
Thunderbird Treatment Center Activities
Admission
Medical Intake
Treatment Program
Discharge
10
VHIP Integration:
Screening, Vaccination and Testing
Admission
Medical Intake
Risk Factor Screening,
Education, and Counseling
Vaccination
Treatment Program
Testing
Discharge
11
Risk Factor Screening,
Vaccination, and Testing
• Risk assessment conducted by VHIP Health
Educator/nursing staff
− Use of hardcopy instrument
• Opportunity for education/counseling
− Provision of printed educational materials
• Universal vaccination offered for hepatitis A/B
– Personal vaccination record for follow up
• Universal testing offered for hepatitis C/HIV
12
VHIP Integration: Post-Test Counseling
Admission
Medical Intake
Risk Factor Screening,
Education, and Counseling
Vaccination
Testing
Treatment Program
Counseling
Discharge
13
Post-Test Counseling
• Hepatitis and HIV test results
– Provided by VHIP Health Educator if negative
– Provided by clinical provider if positive
• Post-test counseling includes education with focus
on a risk reduction plan
• Vaccines offered again (if initially declined and
appropriate)
• Participants with positive results are recommended
to receive confirmatory testing and if appropriate,
specialty referral
14
VHIP Integration: Group Education
Admission
Medical Intake
Risk Factor Screening,
Education, and Counseling
Vaccination
Testing
Group
Education
Treatment Program
Counseling
Discharge
15
Group Educational Activities
• Monthly Group hepatitis educational session
– All clients
– Conducted by counselor
– Hepatitis C video shown
– Pre/post tests administered (recently stopped)
• Hepatitis C support group under consideration
16
VHIP Integration:
Existing Data Collection
Admission
Medical Intake
Risk Factor Screening,
Education, and Counseling
Vaccination
Testing
Group
Education
Treatment Program
Counseling
Discharge
17
VHIP Integration: Existing and
Proposed Data Collection
Admission
Medical Intake
Group
Education
Risk Factor Screening,
Education, and Counseling
Vaccination
Testing
Treatment Program
Counseling
Discharge
18
Data Collection, Analysis and Use
• Hardcopy data entered into Access database
• Processed to ensure data quality
– Checking for duplicates
– Follow up on missing/incomplete/inaccurate
information
– Double entry
• Analysis for:
– Epidemiology
– Quality improvement of program
19
VHIP Patient Population
• From 9/2002 and 9/2005: 1302
VHIP participants
• 78% men
• 30% AI/AN
20
VHIP Participant Ages
(n= 1302)
450
400
Frequency
350
300
250
200
150
100
50
0
18-25 26-30 31-40 41-50
51+
Age Categories
21
VHIP Participant Race/Ethnicity
(n= 1155)
Other Hispanic
1%
5%
AI/AN
30%
White
42%
Black
20%
Asian/PI
2%
22
Hepatitis A/B Vaccination
(n=1302)
49% of VHIP Participants Offered Vaccination (634-641)
79% of Offered gave Consent (502-506)
21% with No Consent (132-135)
88% of Offered were Vaccinated (555-562)
23
2005 Quality Improvement Around Vaccination
Increased
(n=?)
73% to 98%
% of VHIP Participants Offered Vaccination
% of Offered Gave Consent
Discrepancies
decreased
% with No Consent
9% to 3%
% of Offered Vaccinated
Identify Reasons
Calculate
Hypothetical
Immunity levels
Other
Tracking/follow-up
Hepatitis Test Results
24
Hepatitis C Testing (n=1302)
60% of VHIP Participants Offered Testing (784)
76% of Offered gave Consent (595)
24% with No Consent (189)
79% of Offered were Tested (621)
26% of Tested were Positive (163)
74% Negative (458)
Post-test Counseling/Risk Reduction Plan
Provider Visit
25
2005 Quality Improvement Around Testing
(n=?)
Increased
62% to 98%
% of VHIP Participants Offered Testing
% of Offered gave Consent
% with No Consent
% of Offered were Tested
Discrepancies Identify Reasons
decreased
24% to 0%
Calculate
Hypothetical
Prevalence
% of Tested were Positive
Provider Visit
Other
% Negative
QI
Post-test Counseling/Risk Reduction Plan
Tracking/follow-up
26
Past/Future VHIP Challenges
•
•
•
•
•
Lack of standardization
Staffing turnover
Poor data quality
No feedback of data for quality improvement
Measuring effectiveness of education and
counseling
• Appreciation of data use for epidemiology
• Communication between multiple stakeholders
• Project sustainability
27
Address Challenges through Standardization
Developing Consensus
with Stakeholders
Development of
Uniform
Screening Tool
Standardization
Through:
Training of Staff
Creation of Standards and
Procedures Manual
28
Benefits of Standardization
Project
Standardization
Minimizes Impact
of Staff Turnover
Ensures Data
Quality
Prepares for
Expansion/Exportation
Promotes
Sustainability/
Integration
29
Lessons Learned
• Identify changes with core program accurately in
order to better enhance integration; remain flexible
• Standardize as much as possible
• Awareness of differing priorities when multiple
stakeholders; encourage input from all
• Designate dedicated staff person(s) to serve as a
bridge between multiple stakeholders
• Demonstrate usefulness of data collection
• Consider resources necessary for successfully
addressing problems identified
30
Thank You
31
Contact Information
Urban Indian Health Institute
Seattle Indian Health Board
P.O. Box 3364
Seattle, WA 98114
Phone: (206) 812-3030
Fax: (206) 812-3044
Email: info@uihi.org
Website: www.uihi.org
32
© Copyright 2025


