The Utilization of ProFloc as a Fishmeal Replacement in
33 The Utilization of ProFloc™ as a Fishmeal
Replacement in Diets for Pacific White
Shrimp, Litopenaeus vannamei
By Andy Logan, VP of Research and Development, Nutrinsic Corpora on, Glendale, Colorado, USA Abstract Nutrinsic Corpora on manufactures a single‐cell protein product called ProFloc™. ProFloc™ is a valuable source of protein and other nutri onal compo‐
nents for animal feed; it is sustainably produced and is available throughout the year. Nutrinsic’s first produc on facility in the United States is now online and is capable of producing 5,000 tons of ProFloc™ per year. During the experi‐
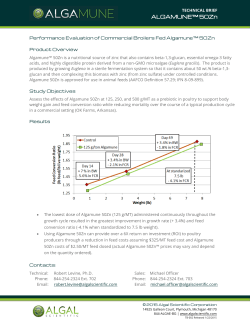
mental feeding trial described herein, white shrimp (Litopenaeus vannamei) growth as the animals were reared for 8 cantly be er than the unfed controls as weeks in a research pond within 144, 1 measured by growth rates (mass gained 3
m cages. The ini al mass of the animals per me and specific growth rate). was approximately 10g. Feed was deliv‐
Mortality was equivalent throughout the ered onto feeding trays (one per cage) cages and there was no correla on to twice per day for 8 weeks. At the com‐
treatment. These results are consistent ple on of 8 weeks, the animals were with completed laboratory trials in which removed and weighed. Results show menhaden fishmeal was completely that ProFloc™ performs iden cally to replaced with ProFloc™. It can be con‐
fishmeal as measured by growth rate in cluded that ProFloc™ can replace up to white shrimp. Analysis of variance 100% of high‐quality fishmeal in feeds for showed that all feeds performed equally white shrimp. to one another and signifi‐
were fed a conven onal feed in which fishmeal was progressively replaced with Nutrinsic’s ProFloc™ ingredient up to 100% replacement. A la n‐square design was used to determine the effect of ProFloc™ inclusion rate on shrimp Figure 1. Close up of pen and
airliŌ pump.
Figure 2. Layout of the pens
within the pond
AQUAFEED::ADVANCES IN PROCESSING & FORMULATION from Aquafeed.com Vol. 7 Issue 1 34 Experimental animals and system Table 1. Research formula ons used in the feeding trial White shrimp were collected from a 3.5 hectare (ha) produc on pond located in the Guayas Province of Ecuador. Shrimp used in the feeding trial were in the 75th day of culture a er having been stocked at 0.6g. These shrimp were then used to stock 144 enclosed net pens with dimen‐
sions of 1m x 1m x 1.2m within a 1.75 ha research pond (Figures 1and 2). The wa‐
ter depth in the pond was 1m for a total water volume within each pen of 1m3. Airli pumps were located in the center of each pen to compensate for reduced circula on of water within the experi‐
mental system. The sides of the bo om‐
less pens were buried to allow direct contact between the shrimp and pond bo om while preven ng shrimp from escaping. Health status of the stock ani‐
mals was determined to be normal prior to stocking by the farm’s biologist via
examina on of hepatopancreas lipid con‐
tent, microtubule integrity, and gross signs of disease. Shrimp were transport‐
ed approximately 500m to the research pond in aerated tanks to minimize stress. Net pens were organized into 12 rows and 12 columns with approximately 1m between pens to allow for water circula‐
on (Figure 1). The experimental system was divided into 4 quadrants of 36 pens each to replicate the experiment at mul‐
ple stocking densi es. For the sake of brevity, only the data from the quadrant that tested the ProFloc™ ingredient in the experimental feed and at the farm’s accepted stocking density of 12 animals per m2 is included in this publica on. The fishmeal used for all diets was sourced in Ecuador and contained 60.2% crude protein (N*6.25). Sta s cal so ‐
ware (CRAN, version 2.9.1) was used to select randomly the 6x6 La n‐square arrangements for each quadrant. To sa sfy the requirements of a La n‐
square design, 6 treatments were includ‐
Research Formula ons Feed “B” Feed “C” Feed “D” Feed “E” Feed “F” % ProFloc™ 0.00 2.50 5.00 10.00 15.00 An ‐Fungal 0.05 0.05 0.05 0.05 0.05 0.05 0.05 0.05 0.05 0.05 0.60 0.60 0.60 0.60 0.60 CaCO3 3.50 3.50 3.50 3.50 3.50 Fish Meal 15.00 12.50 10.00 5.00 0.00 Molasses 5.00 5.00 5.00 5.00 5.00 Fish Oil 0.00 0.17 0.33 0.67 1.00 Lecithin Liquid 3.30 3.30 3.30 3.30 3.30 PO4CaH dibasic 4.50 4.50 4.50 4.50 4.50 Mineral Premix 0.01 0.01 0.01 0.01 0.01 Vitamin Premix 0.08 0.08 0.08 0.08 0.08 Soybean, 46% 36.10 36.03 35.97 35.83 35.70 Squid Meal, 8.00 8.00 8.00 8.00 8.00 Vitamin C 0.01 0.01 0.01 0.01 0.01 So Red Wheat Grain 23.80 23.70 23.60 23.40 23.20 TOTAL 100.00 100.00 100.00 100.00 100.00 B C D E F An ‐Oxidant Ethoxyquinone Binder, Aglu nate Feed ed within each 6x6 quadrant ‐ an unfed control and diets having 0, 17, 33, 67, or 100% fishmeal replaced by ProFloc™. The unfed control was designated as treatment “A”. The experimental formu‐
la ons shown in Table 1 were designated as treatments “B‐F”. ProFloc™ analyses are provided in Table 3. All ingredients were ground to 200μm or smaller prior to being mixed in a rotary batch mixer. Diets were manually fed into a condi oner and pelleted with a 3/32 inch die. To avoid contamina on between diets during manufacturing, an ini al batch of feed was discarded before the test diet was collected and stored for later use. Saltwater stability tests showed that the pellets remained intact for 4‐6 hours for all diets. There ap‐
peared to be no difference between sta‐
bility of the full fishmeal diets and diets with 100% of the fishmeal replaced with the ProFloc™ ingredient. During the experimental period, feed for each pen and each feeding me was weighed and the mass was recorded. Feed was placed on feed trays within each pen each day in the morning (~0800) and in the a ernoon (~1400). Ini al feed rate for each pen was 2.5% of the ini al biomass per day. Feed rate was adjusted up or down 0.5% of the ini al biomass per day based on amount of feed remaining in the trays as ob‐
AQUAFEED::ADVANCES IN PROCESSING & FORMULATION from Aquafeed.com Vol. 7 Issue 1 35 Table 2. Calculated composi on of research feeds served two hours a er each feeding. Calculated Composi on of Research Feeds % ProFloc™ The pond area surrounding the net pens was stocked with animals from the same pond as the experimental system at an approximate density of 35,000 shrimp per hectare to maintain typical condi‐
ons within the pond and to prevent biofouling of the net pens. The outer pond was fed commercial shrimp feed on feed trays at a maintenance rate (60‐75% of the rates recommended for op mal growth by this farm’s feed table) to avoid water quality issues. Rates of feed addi‐
on within the experimental pens were adjusted weekly based on feed table guidelines using sampled shrimp sizes and survival curve es ma ons. A er 8 weeks, the pond was drained and shrimp in the experimental system were count‐
ed and weighed to determine growth, survival and feed conversion ra os. There were therefore two me points for the collec on of animal masses: 1) at the ini a on of the trial and 2) at its comple‐
on. No intermediate mass measure‐
ments were taken. 0.00 “B” 2.50 “C” 5.00 “D” 10.00 “E” 15.00 “F” Moisture 9.95 9.74 9.53 9.12 8.70 Protein, Crude 34.70 35.03 35.37 36.03 36.70 Fiber, Crude 1.94 1.97 2.00 2.05 2.11 Ash, Total 15.40 15.23 15.07 14.73 14.40 Fat, Total 5.54 5.56 5.58 5.63 5.67 Fat, Marine 1.44 1.43 1.42 1.39 1.37 Cholesterol 0.05 0.05 0.05 0.04 0.03 Phospholipid Calcium 2.10 2.88 2.10 2.79 2.10 2.71 2.09 2.54 2.09 2.37 Phosphorus 1.60 1.57 1.55 1.49 1.44 Sodium 0.24 0.24 0.24 0.25 0.25 Potassium 1.13 1.13 1.12 1.12 1.11 Magnesium 0.28 0.28 0.28 0.28 0.28 Iron 191.00 191.33 191.67 192.33 193.00 Zinc 56.00 54.12 52.23 48.47 44.70 Manganese 44.00 44.00 44.00 44.00 44.00 Copper 19.00 20.07 21.13 23.27 25.40 Selenium 0.58 0.52 0.46 0.33 0.21 Arginine 2.29 2.19 2.10 1.90 1.71 Lysine 2.24 2.11 1.99 1.74 1.49 Methionine 0.72 0.67 0.62 0.52 0.42 Methioni+Cys ne 1.14 1.08 1.01 0.89 0.76 Tryptophan 0.40 0.38 0.37 0.33 0.30 A Re nol X 100 240.00 240.00 240.00 240.00 240.00 Data were tabulated and weight gain, total biomass, growth per week, specific growth rate, and mortality were calculat‐
ed or recorded. Analysis of Variance (ANOVA) was performed at a confidence level of 95% (alpha = 0.05) to determine differences between treatments. D Cholecalciferol X 100 200.00 200.00 200.00 200.00 200.00 Results E Tocopherol 45.00 45.00 45.00 45.00 45.00 C Ascorbic Acid X100 35.00 35.00 35.00 35.00 35.00 B1 Thiamine 5.10 5.10 5.10 5.10 5.10 B2 Riboflavin 6.80 6.80 6.80 6.80 6.80 B6 Pyridoxine 13.80 13.80 13.80 13.80 13.80 Niacin 27.10 27.10 27.10 27.10 27.10 Pantothenic Acid 7.90 7.90 7.90 7.90 7.90 Bio n 0.17 0.17 0.17 0.17 0.17 Inositol 740.00 740.00 740.00 740.00 740.00 Choline 1865.00 1865.00 1865.00 1865.00 1865.00 3.30 3.30 3.30 3.30 3.30 Size at stocking was 10.14 ± 0.5g with no difference between treatments (ANOVA, p>0.05). Survival was sta s cally higher for all treatments receiving feed than for those unfed controls (treatment A); p=.00004) and equivalent for all diets receiving feed (p=0.14). Nonetheless, variability in survival coupled with the fact that dead animals could not be re‐
moved from the cages during the experi‐
ment (because they could not be seen) resulted in the inability to calculate feed conversion ra os. To evaluate differ‐
Folic Acid AQUAFEED::ADVANCES IN PROCESSING & FORMULATION from Aquafeed.com Vol. 7 Issue 1 36 ences between the treatments, parame‐
ters that do not rely upon survival were therefore used. Thus, FCR, and total bio‐
mass increase in a cage showed no differ‐
ence between treatments, but mass growth per unit me and specific growth rate (SGR; [Log10(final mass) – Log10
(ini al mass)]/experiment dura on in days) did show differences. These la er parameters showed that all treatments grew considerably faster than the unfed controls and all treatments, regardless of ProFloc™ inclusion levels, exhibited iden‐
cal growth as measured by ANOVA (alpha = 0.05; Table 4 and Figure 3). Mass gain per week was very high for this farm (generally 1.1g/week) and as much as 1.3 g/week for all fed treatments. Conclusions The results from this pond‐scale trial demonstrated that Nutrinsic’s ProFloc™ ingredient can be used as a fishmeal re‐
placement in feeds for white shrimp with no reduc on in growth rates. Growth rates were high for all treatments receiv‐
ing feed were on the upper end of growth rates experienced in this area of Ecuador. Though mortality varied, there were no differences between those cages receiving feed and all cages receiving feed had lower mortality rates versus the unfed controls. Future plans include evalua ng the immunity enhancing ben‐
efits of ProFloc™ as well as comple ng a produc on‐scale evalua on. Table 3. Characteris cs of the ProFloc™ ingredient used in the trial Composi on Crude Protein Percentage (%) 62 Vitamins Niacin 83.3 mg/kg Crude Fat 6.5 Thiamine B1 7.7 mg/kg Mineral Material 12.5 Riboflavin 39.0 mg/kg Crude Fiber 1‐2 Vitamin B12 12.0 mg/kg Vitamin E 29.8 IU/kg Amino Acids % of Sample as Fed Alanine 3.82% Arginine 3.60% Aspar c Acid Minerals Calcium 6.1 g/kg 6.36% Iron 0.26 g/kg Glutamic Acid 8.04% Potassium 5.1 g/kg Glycine 2.81% Magnesium 2.5 g/kg His dine 1.46% Sodium 6.9 g/kg Isoleucine 3.38% Phosphorus 11.1 g/kg Leucine 5.06% Zinc 33.0 mg/kg Lysine 4.34% Copper 55.0 mg/kg Methionine 1.41% Boron 2.0 mg/kg Cysteine 0.55% Phenylalanine 3.29% Cobalt 2.5 mg/kg Proline 2.77% Manganese 8.0 mg/kg Serine 2.82% Taurine 0.25 Other data Fa y Acids 4‐5% (60% saturated) Threonine 3.11% Co Q10 0.004% Tryptophan 0.98% 8‐12% Tyrosine 2.83% Valine 3.52% Total 60.4% Free Nucleic Acids Moisture content < 5% Table 4. Response of animals fed research formulations at a stocking density of 12 animals / M2
Ini al Weight Ini al Weight Final Weight (g, average) (g, average) (g, average) A (unfed) 9.92a 17.34a B (0.0%) 9.89a C (2.5%) Treatment (% ProFloc™) SEM, SD SGR SEM, SD 0.93a 0.04, 0.10 0.0043a 0.0002, 0.0004 19.06b 1.15b 0.06, 0.15 0.0051b 0.0002, 0.0005 10.17a 20.09b 1.24b 0.03, 0.07 0.0053b 0.0001, 0.0003 D (5.0%) 9.98a 19.66b 1.21b 0.05, 0.11 0.0053b 0.0002, 0.0004 E (10.0%) 9.98a 20.12b 1.27b 0.06, 0.16 0.0054b 0.0002, 0.0005 F (15.0%) 9.91a 18.95b 1.13b 0.03, 0.08 0.0050b 0.0002, 0.0003 .52 0.00004 0.0003 0.0016 P value *different subscripts within a column indicate sta s cal difference at 95% confidence AQUAFEED::ADVANCES IN PROCESSING & FORMULATION from Aquafeed.com Vol. 7 Issue 1 37 Figure 3. Weight gain per week for animals receiving research diets and stocked at 12 animals /M2.
More informa on: Andy Logan, Ph.D. Email: andy.logan@nutrinsic.com Reprinted from Vol.7 issue 1 AQUAFEED: Advances in Processing & FormulaƟon
— the quarterly magazine of Aquafeed.com — AQUAFEED::ADVANCES IN PROCESSING & FORMULATION from Aquafeed.com Vol. 7 Issue 1
© Copyright 2025
