
How To Write Your Own Stock & Futures Trading Plan
Jim Berg, Tim Wilcox & John Atkinson How To Write Your Own Stock & Futures Trading Plan A Step-by Step Template to your Trading Success Foreword by Dr Brett Steenbarger PhD, author of The Psychology of Trading Tim Wilcox Jim Berg Tools of the Trade Trading Discipline Trading Strategies Money & Risk Management Set Ups and Entries 20 Golden Rules By Tim Wilcox, UK private trader at Trade2Win.com & Jim Berg, author of The Stock Trading Handbook & John Atkinson, Jim’s co-editor of the Investing & Online Trading newsletter & author of The Atkinson-Guppy Articles & 7 Secrets to Profitable Online Trading Copyright © Tim Wilcox, Jim Berg, John Atkinson & Sharetradingeducation.com 2008 1 2 How to Write Your Own Stock & Futures Trading Plan Copyright© 2008 Tim Wilcox, Jim Berg, John Atkinson & Sharetradingeducation.com Acknowledgements: The authors would www.trade2win.com for their contributions. like to thank Dr Brett Steenbarger and the traders at First Edition: July 2006 3rd Edition: November 2008, published by www. ShareTradingEducation.com Disclaimer In preparing this publication, the authors and the publisher, ShareTradingEducation.com (“STE”), as Corporate Authorized Representative of Avestra Capital Pty Ltd (“Avestra”), AFSL 292464, have not taken into account the investment objectives, financial situation and particular needs of any particular investor. Before making an investment decision on the basis of this publication and the accompanying material, the investor needs to consider, with or without the assistance of an adviser, whether the advice is appropriate for them in view of their individual financial circumstances. Any projections made in this publication are estimates only and no guarantee is provided that those projections will be realized. Further, the authors, Trade2Win.com (“T2W”) and the publisher, STE and/or Avestra do not warrant the accuracy of the information in this publication. The authors, T2W, STE and/or Avestra and its officers, employees, agents, associates and alliance partners (“Associates”) may have or may obtain an interest in the securities referred to in this letter and will receive commissions, brokerage and other fees from dealing in the securities or advising in respect of the proposed listing of the securities. The authors, T2W, Avestra and/or STE believe that the information contained in this publication was accurate at the time it was compiled. The authors, T2W, Avestra and/or STE do not warrant that the information contained in this publication is accurate, complete, reliable or up to date and to the fullest extent permitted by law disclaims all liability of The authors, T2W, Avestra, STE and its Associates for any loss or damage suffered by any person by reason of the use by that person of, or their reliance on any information contained herein, whether arising from the negligence of the authors, T2W, Avestra, STE or its Associates or otherwise. All reasonable steps and due diligence have been taken in preparing this document. However, it may contain ideas that are not appropriate to you or your style of investing or trading, so it is up to you to do your own research and draw your own conclusions. By itself, this document will not enhance your investing or trading performance, nor will it prevent you from incurring losses. Any losses that are incurred are the sole responsibility of each trader and investor. The decision to trade and the method of trading is for the reader alone to decide. Direct investing in the stock market can result in financial loss. Past performance is no indication of future performance. The authors, T2W, Avestra and/or STE expressly disclaim all and any liability to any person, whether a purchaser of this publication or not, in respect of anything and of the consequences of anything done or omitted to be done by any such person in reliance, whether whole or partial, upon the whole or any part of the contents of this publication. Copyright The information contained in this publication is copyright © 2008 and for the sole use of readers who have purchased it. All rights reserved. No part of this publication may be reproduced, copied or circulated to other readers. Each issue incorporates fingerprint protection that enables us to track the original source of pirate copies. Offenders may be prosecuted Disclaimer: Direct investing in the stock market can result in financial loss. Historical results are no guarantee of future returns. No representation is being made that any account will or is likely to achieve profits or losses similar to those shown. Stock tips or ‘buy’ or sell recommendations are not provided. This educational information is not designed to replace your Licensed Financial Consultant or your Stockbroker. It has been prepared without regard to any particular person's investment objectives, financial situation and particular needs. This information is of a general nature only so you should seek advice from your broker or other investment advisors as appropriate before taking any action. The decision to trade and the method of trading is for the reader alone to decide. Avestra Securities Pty Ltd (Avestra) AFSL 292464, and ShareTradingEducation.com (“STE”), as Corporate Authorized Representative of Avestra, disclaims all liability of Avestra, STE and its Associates for any loss or damage suffered by any person by reason of the use by that person of, or their reliance on any information contained herein, whether arising from the negligence of Avestra, STE or its Associates or otherwise. Refer also to the full disclaimer at the back of each newsletter Edition and our Terms of Use. 3 How to Write Your Own Stock & Futures Trading Plan Copyright© 2008 Tim Wilcox, Jim Berg, John Atkinson & Sharetradingeducation.com CONTENTS – Click on the links below Foreword by Dr Brett Steenbarger PhD 4 Introduction by John Atkinson 6 Glossary of Terms 14 Chapter 1 Trading Plan Overview 15 Chapter 2 You and Your Goals 20 Chapter 3 Markets and Tools of the Trade 30 Chapter 4 Money and Risk Management 46 Chapter 5 Exit Strategies 67 Chapter 6 Trade Strategies – Set ups and Entries 79 Chapter 7 More on Jim Berg’s Trading & Investing Strategies 87 Chapter 8 Record Keeping and Discipline 96 Chapter 9 20 Golden Rules 102 Chapter 10 Trading Plan Template Summary & Conclusion 110 Bibliography 118 Glossary 119 Jim Berg’s and Other Trading Tools including Discounts for Purchasers of this ebook 120 Disclaimer: Direct investing in the stock market can result in financial loss. Historical results are no guarantee of future returns. No representation is being made that any account will or is likely to achieve profits or losses similar to those shown. Stock tips or ‘buy’ or sell recommendations are not provided. This educational information is not designed to replace your Licensed Financial Consultant or your Stockbroker. It has been prepared without regard to any particular person's investment objectives, financial situation and particular needs. This information is of a general nature only so you should seek advice from your broker or other investment advisors as appropriate before taking any action. The decision to trade and the method of trading is for the reader alone to decide. Avestra Securities Pty Ltd (Avestra) AFSL 292464, and ShareTradingEducation.com (“STE”), as Corporate Authorized Representative of Avestra, disclaims all liability of Avestra, STE and its Associates for any loss or damage suffered by any person by reason of the use by that person of, or their reliance on any information contained herein, whether arising from the negligence of Avestra, STE or its Associates or otherwise. Refer also to the full disclaimer at the back of each newsletter Edition and our Terms of Use. How to Write Your Own Stock & Futures Trading Plan Copyright© 2008 Tim Wilcox, Jim Berg, John Atkinson & Sharetradingeducation.com 4 Foreword by Brett N. Steenbarger, Ph.D www.brettsteenbarger.com A new business, before it seeks capital from a bank or venture capital firm, is expected to develop a detailed business plan. This document explains the competitive situation in the marketplace, niches of opportunity, and the ways in which the new business will exploit those niches. Similarly, a professional football team scouts its opponents, determines their strengths and weaknesses, and develops a game plan to exploit the weaknesses and cope with the strengths. When a platoon goes on a reconnaissance mission, it is with a specific plan that reflects an overall mission, evaluation of the enemy, assessment of the terrain, status of the troops available for combat, and the time available. Planning is a universal aspect of performance fields, and trading is no different. In The Stock Trading Plan Template, you will find a treasure trove of considerations in generating plans to guide your activities as a trader or investor. John Atkinson, Jim Berg, Daryl Guppy, Alan Hull and Tim Wilcox have done a masterful job of summarising the most important facets of Trading Plans: ¾ Assessments of your strengths ¾ Details of: Your trading methods Your overall goals and Your methods of risk management. The message that the authors convey is that trading is a serious business, requiring planning that is every bit as thoughtful as the strategic thinking of athletic coaches, military leaders, or corporate chief executive officers. Conducted properly, planning is both a psychological aid—orienting the trader—and a logical one, charting a path to success. If there is a message I can add to the authors’ wisdom, it is this: Planning, while necessary to success in performance fields, is not sufficient. Look at athletics, the military, and performing arts and you will see that plans are rehearsed with structured drills. Disclaimer: Direct investing in the stock market can result in financial loss. Historical results are no guarantee of future returns. No representation is being made that any account will or is likely to achieve profits or losses similar to those shown. Stock tips or ‘buy’ or sell recommendations are not provided. This educational information is not designed to replace your Licensed Financial Consultant or your Stockbroker. It has been prepared without regard to any particular person's investment objectives, financial situation and particular needs. This information is of a general nature only so you should seek advice from your broker or other investment advisors as appropriate before taking any action. The decision to trade and the method of trading is for the reader alone to decide. Avestra Securities Pty Ltd (Avestra) AFSL 292464, and ShareTradingEducation.com (“STE”), as Corporate Authorized Representative of Avestra, disclaims all liability of Avestra, STE and its Associates for any loss or damage suffered by any person by reason of the use by that person of, or their reliance on any information contained herein, whether arising from the negligence of Avestra, STE or its Associates or otherwise. Refer also to the full disclaimer at the back of each newsletter Edition and our Terms of Use. How to Write Your Own Stock & Futures Trading Plan Copyright© 2008 Tim Wilcox, Jim Berg, John Atkinson & Sharetradingeducation.com 5 A plan is not a document to be formulated and then tucked away in a drawer. It is a road map for what performance researcher K. Anders Ericsson calls deliberative practice. You drill and drill a plan until it becomes automatic. That is how SWAT teams, surgeons, elite military units, and Olympic champion boxers achieve their success: they turn plans into habits. Show me a performance field—chess, sport, or music—and I will show you a field where success is determined not only by planning, but by the use of plans to guide intensive practice routines. The plan you develop from this Template is your opening step as an elite performer. Whether you ultimately succeed or not will depend upon whether your plan guides you in the practice of skills that account for trading success. I am a psychologist and I am as sensitive to the role of psychology in trading as anyone. But I am also a trader and someone who works daily with professional traders in their trading setting. I can tell you with certainty that there is much more to trading success than having a good mindset and a noble set of intentions. Trading, no less than music, athletics, or any other performance field, requires both talents and skills. Your Trading Plan is your blueprint for using your talents to hone your skills and find your success. This book is a wonderful start to your performance adventure. Good luck! Dr Brett Steenbarger PhD www.brettsteenbarger.com Brett N. Steenbarger, Ph.D. is Associate Clinical Professor of Psychiatry and Behavioral Sciences at SUNY Upstate Medical University in Syracuse, NY and author of The Psychology of Trading (Wiley, 2003) and ‘Enhancing Trader Performance’ (Wiley 2007). As Director of Trader Development for Kingstree Trading, LLC in Chicago, he has mentored numerous professional traders and coordinated a training program for traders. An active trader of the stock indexes, Brett utilises statistically-based pattern recognition for intraday trading and posts his results at www.traderfeed.blogspot.com. Brett does not offer commercial services to traders, but maintains an archive of articles and a trading blog at www.brettsteenbarger.com. His book, ‘Enhancing Trader Development, is due for publication soon (Wiley). Disclaimer: Direct investing in the stock market can result in financial loss. Historical results are no guarantee of future returns. No representation is being made that any account will or is likely to achieve profits or losses similar to those shown. Stock tips or ‘buy’ or sell recommendations are not provided. This educational information is not designed to replace your Licensed Financial Consultant or your Stockbroker. It has been prepared without regard to any particular person's investment objectives, financial situation and particular needs. This information is of a general nature only so you should seek advice from your broker or other investment advisors as appropriate before taking any action. The decision to trade and the method of trading is for the reader alone to decide. Avestra Securities Pty Ltd (Avestra) AFSL 292464, and ShareTradingEducation.com (“STE”), as Corporate Authorized Representative of Avestra, disclaims all liability of Avestra, STE and its Associates for any loss or damage suffered by any person by reason of the use by that person of, or their reliance on any information contained herein, whether arising from the negligence of Avestra, STE or its Associates or otherwise. Refer also to the full disclaimer at the back of each newsletter Edition and our Terms of Use. How to Write Your Own Stock & Futures Trading Plan Copyright© 2008 Tim Wilcox, Jim Berg, John Atkinson & Sharetradingeducation.com 6 Introduction Renowned trader authors such as Louise Bedford, Jim Berg. Dr Alexander Elder, Daryl Guppy, Alan Hull, Dr Brett Steenbarger, Chris Tate, Dr Van Tharp, Frank Watkins and others did not suddenly decide to write a book on market trading or investing because “…. it seemed like a good idea at the time.” They started writing because they had been through personal experiences (good, bad or even ugly) which they considered other investors could benefit from, by sharing what they had learnt. In this ebook we introduce Tim Wilcox from England. As an example of how powerful the electronic grapevine works, we found out about Tim’s stand-out work through the Singapore based Stockmeetingplace.com forum in Australia, which referred to the forum on which Tim contributes in the UK, called Trade2Win.com. Like many aspiring traders, Tim Wilcox entered the trading world knowing absolutely nothing about it. Nonetheless, he was convinced that it was the fast track to wealth and that he could do it. This wasn’t just his gut feeling, it was endorsed by the ad’ in his local Exchange & Mart which read: . . .”some (people) have just made up to £32,500 in 28 days, and so could you”. Excited, he paid several hundred pounds for a large binder that, supposedly, contained everything he needed to know to trade options. That was back in late 1998. Surprise, surprise, Tim never traded a single contract and quickly came to the conclusion that perhaps he’d been somewhat hasty in his conviction that trading was the “....easy option”. After a fallow period of a few years and a handful more courses, the penny finally dropped in early 2002. Tim realised that the market gobbles up amateurs like him and spits them out again before breakfast. To stand even a slim chance of survival in this game, he had to start to treat trading and investing as a business. This means he had to acquire the appropriate tools and learn the necessary skills. In other words, he would have to do some hard work. During this period of study, Tim became very aware of the fact that books, magazine articles and message boards etc. all seemed to be singing from the same song sheet on the subject of Trading Plans – “quite simply, you’ve got to have one! “ However, he couldn’t find anyone or anything that explained in any real detail how to go about writing one. The ‘Stock Trading Plan Template’ is the result of this quest. Disclaimer: Direct investing in the stock market can result in financial loss. Historical results are no guarantee of future returns. No representation is being made that any account will or is likely to achieve profits or losses similar to those shown. Stock tips or ‘buy’ or sell recommendations are not provided. This educational information is not designed to replace your Licensed Financial Consultant or your Stockbroker. It has been prepared without regard to any particular person's investment objectives, financial situation and particular needs. This information is of a general nature only so you should seek advice from your broker or other investment advisors as appropriate before taking any action. The decision to trade and the method of trading is for the reader alone to decide. Avestra Securities Pty Ltd (Avestra) AFSL 292464, and ShareTradingEducation.com (“STE”), as Corporate Authorized Representative of Avestra, disclaims all liability of Avestra, STE and its Associates for any loss or damage suffered by any person by reason of the use by that person of, or their reliance on any information contained herein, whether arising from the negligence of Avestra, STE or its Associates or otherwise. Refer also to the full disclaimer at the back of each newsletter Edition and our Terms of Use. How to Write Your Own Stock & Futures Trading Plan Copyright© 2008 Tim Wilcox, Jim Berg, John Atkinson & Sharetradingeducation.com 7 Surprisingly, Tim still regards himself as a novice trader and feels that he has a long way to go before he turns his part time hobby into his full time profession. However, he remains confident and optimistic that one day his dream will become reality. Tim Wilcox says: “If you want to make a lot of money very quickly – especially if you haven’t got a lot to start with – play the lottery, the odds are better there. It’s taken me years to accept fully what is blatantly obvious to most people; successful traders and investors have a thorough knowledge of their subject and a thorough set of skills to match. Great traders and investors have a dash of natural talent as well. There are no short cuts; the market rewards those people who pay their dues. The bad news is that this means many hours of hard work. The good news is that anyone can study the business and learn the necessary skills in the comfort of their own home, in their own time and at very little cost. This is very difficult to do in almost all other professions and the rewards don’t even begin to compare. If, like me, you’re finding the trading or investing road pretty bumpy, poorly signposted and replete with cul de sacs – take heart as it means you’re probably doing something right. Trading isn’t meant to be easy. On the contrary, it’s an extraordinarily efficient griddle designed to shake out those who are greedy, impatient and lazy. I’ve come very close to falling through that griddle several times. It may still happen, who knows. In the meantime, to help me to remain in the game, I ensure that my goals are modest, I accept that it will take time to acquire the necessary skills and I try to devote a little time to the markets every day. This approach reduces my frustration levels, takes the pressure off me to become successful and minimises the risk of me losing all my money before I reverse the trend and start to become consistently profitable”. In contrast, my business partner Jim Berg is a former broker, private trader and lecturer with over 25 years experience in the investment industry. He has appeared on CNBC Asia, Market Wrap and Foxtel’s Sky Business and is a regular guest speaker at such institutions as the Australian Stock Exchange (ASX), the Sydney Futures Exchange (SFE), the Australian Technical Analysts Association (ATAA) & the Traders Expos at capital cities throughout Australia. His articles have been published in the ASX newsletter, Shares, Personal Investor, Your Trading Edge in Australia & Stocks and Commodities in USA. Jim's first book The Share Trader's Handbook was a sell-out success & is no longer available in a book format. It has been completely updated as an ebook 'The Stock Trading Handbook – Fundamental and Technical Analysis Combined'. Disclaimer: Direct investing in the stock market can result in financial loss. Historical results are no guarantee of future returns. No representation is being made that any account will or is likely to achieve profits or losses similar to those shown. Stock tips or ‘buy’ or sell recommendations are not provided. This educational information is not designed to replace your Licensed Financial Consultant or your Stockbroker. It has been prepared without regard to any particular person's investment objectives, financial situation and particular needs. This information is of a general nature only so you should seek advice from your broker or other investment advisors as appropriate before taking any action. The decision to trade and the method of trading is for the reader alone to decide. Avestra Securities Pty Ltd (Avestra) AFSL 292464, and ShareTradingEducation.com (“STE”), as Corporate Authorized Representative of Avestra, disclaims all liability of Avestra, STE and its Associates for any loss or damage suffered by any person by reason of the use by that person of, or their reliance on any information contained herein, whether arising from the negligence of Avestra, STE or its Associates or otherwise. Refer also to the full disclaimer at the back of each newsletter Edition and our Terms of Use. How to Write Your Own Stock & Futures Trading Plan Copyright© 2008 Tim Wilcox, Jim Berg, John Atkinson & Sharetradingeducation.com 8 Using the strategies demonstrated in this Trading Plan template ebook, our newsletter, his Stock Trading Handbook and his ‘Trading Strategies with JB Charts’ Home Study Course, Jim Berg won the 2002 Personal Investor magazine trading competition in Australia. This was a significant achievement, particularly as this was accomplished in the depths of a worldwide three year bear market. Most traders can make profits in a bull market, as a rising tide lifts most ships. It takes real skill to outperform in a bear market. Over his 25 years of trading the market, Jim Berg has developed trading and investing strategies that really work. Jim is the co-editor of our weekly ‘Investing & Online Trading’ stock market newsletter and answers questions on the share market at the unique ‘Ask Jim Berg’ segment at the Sharescene.com stock market forum. As Jim says: “The easiest way to learn to trade is to have someone take you, step by step, through a series of trades. You then learn their complete trading strategy, entry, stops, exits and why and how they act/react to price moves." Having and sticking to a successful Trading Plan is a vital key to profitability and longevity in the market. In his ebook ‘The Stock Trading Handbook - Fundamental and Technical Analysis Combined' Jim Berg wrote: “There is a well worn cliché “If you fail to plan then you’re planning to fail”. Unfortunately for far too many traders and investors, this is very true. We cannot emphasise strongly enough the importance of having a Trading Plan which, at the very minimum, should list how an investor will: Disclaimer: Direct investing in the stock market can result in financial loss. Historical results are no guarantee of future returns. No representation is being made that any account will or is likely to achieve profits or losses similar to those shown. Stock tips or ‘buy’ or sell recommendations are not provided. This educational information is not designed to replace your Licensed Financial Consultant or your Stockbroker. It has been prepared without regard to any particular person's investment objectives, financial situation and particular needs. This information is of a general nature only so you should seek advice from your broker or other investment advisors as appropriate before taking any action. The decision to trade and the method of trading is for the reader alone to decide. Avestra Securities Pty Ltd (Avestra) AFSL 292464, and ShareTradingEducation.com (“STE”), as Corporate Authorized Representative of Avestra, disclaims all liability of Avestra, STE and its Associates for any loss or damage suffered by any person by reason of the use by that person of, or their reliance on any information contained herein, whether arising from the negligence of Avestra, STE or its Associates or otherwise. Refer also to the full disclaimer at the back of each newsletter Edition and our Terms of Use. How to Write Your Own Stock & Futures Trading Plan Copyright© 2008 Tim Wilcox, Jim Berg, John Atkinson & Sharetradingeducation.com 9 Evaluate market conditions Choose investing and trading strategies Select which share, fund, index etc to buy Detail methods for: Entry and exit conditions Money and risk management, including Position Sizing Stop Loss calculations Protecting profits Setting profit targets Trading Plans must be written down, kept in a prominent position and most importantly, followed with discipline. In his books, Dr Alexander Elder emphasizes the importance of keeping accurate records of all open and completed trades. These can then be used as a basis for reviewing the success of the Trading Plan and for subsequent updates. Many readers may already be aware of their need to have a Trading Plan but may be wondering how to start or update their current plan.” Private UK trader and investor Tim Wilcox laid the foundation for this ebook by preparing what we consider to be an invaluable Template for setting up such a Trading Plan. He originally collated the priceless thoughts and experiences of many traders and investors at the Trade2Win.com forum who collectively and at very real personal costs and profits, have learnt both about the pitfalls and the opportunities within the market. Tim’s initial Trading Plan Template was originally released at www.Trade2Win.com as a small ebook of about 50 questions, with some brief answers suggested by Tim. In it, Tim Wilcox said: “Towards the end of 2004, a thread entitled ‘A Trading Plan – You MUST Have One!’ on the ‘Trading for a Living’ forum was started on www.trade2win.com (T2W). The purpose of the thread was to produce a template by which all investors - regardless of experience, instruments traded, timeframes and brokers etc. - could create a professional trading plan. This document is the result of that thread.” It comprises two main sections with a third section that in time will, hopefully, contain examples of real plans created using the template. Disclaimer: Direct investing in the stock market can result in financial loss. Historical results are no guarantee of future returns. No representation is being made that any account will or is likely to achieve profits or losses similar to those shown. Stock tips or ‘buy’ or sell recommendations are not provided. This educational information is not designed to replace your Licensed Financial Consultant or your Stockbroker. It has been prepared without regard to any particular person's investment objectives, financial situation and particular needs. This information is of a general nature only so you should seek advice from your broker or other investment advisors as appropriate before taking any action. The decision to trade and the method of trading is for the reader alone to decide. Avestra Securities Pty Ltd (Avestra) AFSL 292464, and ShareTradingEducation.com (“STE”), as Corporate Authorized Representative of Avestra, disclaims all liability of Avestra, STE and its Associates for any loss or damage suffered by any person by reason of the use by that person of, or their reliance on any information contained herein, whether arising from the negligence of Avestra, STE or its Associates or otherwise. Refer also to the full disclaimer at the back of each newsletter Edition and our Terms of Use. How to Write Your Own Stock & Futures Trading Plan Copyright© 2008 Tim Wilcox, Jim Berg, John Atkinson & Sharetradingeducation.com 10 The Trading Plan Overview addresses fundamental questions regarding the subject, starting with a simple definition. It then moves on to discuss why investors need a plan at all and, once they have created one, what it will do for them. Those investors who are already convinced of the merits of having a plan, please feel free to skip this section. The Trading Plan Template - This section is the nuts and bolts of the whole document. It comprises ten key units, with a series of questions in each one: about 50 in total. This is rounded off with a final unit: ‘Golden Trading Rules’. The hope is that any investor can use the template to create their very own custom-built trading plan. Make no mistake, it will take time and effort to complete. But, having done so, you will at the very least, gain a greater insight into the kind of investor you are now and enable you to focus on the kind of investor you want to become. Explanatory notes and an outline for a possible answer accompany all the questions. For ease of navigation, there is a reference number at the start of each paragraph. If you get stuck at any point, help is at hand from fellow T2W members. Just post your query at http://www.trade2win.com/boards/showthread.php?t=12585 with the relevant reference number on the thread:. Naturally, you can add elements to your own plan that you think are missing on the template and, conversely, delete elements from the template that you feel are not applicable to your plan. In order that other investors may benefit from your amendments, please post your ideas on the thread above”. At the back of his original document, Tim invited other traders to submit their own Trading Plans to put “flesh on the bones” of his template - to provide a “valuable insight into how different traders interpret it.” Hence in mid 2005 we contacted Tim Wilcox in England as we were about to launch our own Investing & Online Trading stock market newsletter in Australia. We realised that although we were trading different markets from completely the other end of the planet, Tim’s work was still highly suitable and could be adapted for any market in the world - as the principles remain the same. We were delighted when Tim Wilcox replied promptly and agreed to us progressively sharing the result of his significant Trading Plan work in our newsletter. Having the checklist of questions, originally posed by Tim, to think about is a major part of a Trading Plan. Borrowing an experienced trader’s proven system - as a basis to come up with your answers - helps complete the puzzle. Over the course of several months, Jim Berg added solutions from his own experience to provide additional input to Tim’s original work and thereby created a combined Trading Plan Template. Disclaimer: Direct investing in the stock market can result in financial loss. Historical results are no guarantee of future returns. No representation is being made that any account will or is likely to achieve profits or losses similar to those shown. Stock tips or ‘buy’ or sell recommendations are not provided. This educational information is not designed to replace your Licensed Financial Consultant or your Stockbroker. It has been prepared without regard to any particular person's investment objectives, financial situation and particular needs. This information is of a general nature only so you should seek advice from your broker or other investment advisors as appropriate before taking any action. The decision to trade and the method of trading is for the reader alone to decide. Avestra Securities Pty Ltd (Avestra) AFSL 292464, and ShareTradingEducation.com (“STE”), as Corporate Authorized Representative of Avestra, disclaims all liability of Avestra, STE and its Associates for any loss or damage suffered by any person by reason of the use by that person of, or their reliance on any information contained herein, whether arising from the negligence of Avestra, STE or its Associates or otherwise. Refer also to the full disclaimer at the back of each newsletter Edition and our Terms of Use. How to Write Your Own Stock & Futures Trading Plan Copyright© 2008 Tim Wilcox, Jim Berg, John Atkinson & Sharetradingeducation.com 11 This helped the readers of our newsletter adapt and create their own investment or trading plans. It also now forms the basis under which equities are selected and managed in the portfolios of notional long term investing and short term trades which our newsletter tracks and reports on each week. We subsequently decided to collate the series of articles back into a comprehensive document. This ebook, ‘How to Write Your Own Stock and Futures Trading Plan’ is the result. Regardless of whether you invest in the same market as Tim Wilcox in England or Jim Berg in Australia, the aim of this Trading Plan Template is to provide investors and traders with the education to adapt and use in their market, wherever it may be in the world. Tim Wilcox prefers short term trading e.g. of stocks, futures contracts and foreign exchange. As a result, the title of this ebook includes reference to futures - which are featured in the Tim’s contribution, as per his original ebook. In comparison, Jim Berg’s approach leans towards more conservative longer term stock/share investing in fundamentally sound companies. In our newsletter, Jim has also developed a shorter term stock/share trading strategy which is also covered in his Stock Trading Handbook and Chapter 7 of this Trading Plan Template ebook. The exit signals for these notional trades generally occur within a few days to about a month or more. Consequently, in this ebook, Tim Wilcox poses the questions to be considered when writing a Trading Plan and provides some brief solutions from his perspective related to stocks, futures contracts and foreign exchange. Simultaneously, Jim Berg’s focus is on his trading strategies that he uses for long term investing and short term trading of stocks/shares. Hence more in-depth responses to Tim’s original questions are provided in this ebook on stocks than on futures or other instruments. The principles covered in this Trading Plan Template on how to write your own Trading Plan can be applied to the various systems covered in this ebook and many others. The approaches and strategies outlined here are examples of a few, of perhaps hundreds, of different ways to trade the market, for there are as many different trading strategies as there are markets and time frames to trade. Our intent in presenting this Trading Plan Template is to give both beginning and experienced traders an example of the process of putting together a Trading Plan. It is not intended that this Trading Plan Template will ever be used exactly as presented, as each investor’s personality and trading philosophy will differ and result in a personalized trading strategy that suits the individual. Disclaimer: Direct investing in the stock market can result in financial loss. Historical results are no guarantee of future returns. No representation is being made that any account will or is likely to achieve profits or losses similar to those shown. Stock tips or ‘buy’ or sell recommendations are not provided. This educational information is not designed to replace your Licensed Financial Consultant or your Stockbroker. It has been prepared without regard to any particular person's investment objectives, financial situation and particular needs. This information is of a general nature only so you should seek advice from your broker or other investment advisors as appropriate before taking any action. The decision to trade and the method of trading is for the reader alone to decide. Avestra Securities Pty Ltd (Avestra) AFSL 292464, and ShareTradingEducation.com (“STE”), as Corporate Authorized Representative of Avestra, disclaims all liability of Avestra, STE and its Associates for any loss or damage suffered by any person by reason of the use by that person of, or their reliance on any information contained herein, whether arising from the negligence of Avestra, STE or its Associates or otherwise. Refer also to the full disclaimer at the back of each newsletter Edition and our Terms of Use. How to Write Your Own Stock & Futures Trading Plan Copyright© 2008 Tim Wilcox, Jim Berg, John Atkinson & Sharetradingeducation.com 12 Historical results are no guarantee of future performance. No representation is being made that any account will or is likely to achieve profits or losses similar to those shown. Importantly, after reviewing the many suggested answers to the Trading Plan Template questions in this ebook, you then need to determine what’s important to you and how you want your Trading Plan to look like – not Tim’s or Jim’s. It’s essential to develop your own Trading System and Trading Plan to suit your personality, lifestyle and circumstances. The final decisions and responsibility for those decisions will be your own and we must emphasize the disclaimers throughout this ebook and the Terms of Use at www.Sharetradingeducation.com. Any losses that are incurred are the sole responsibility of each individual trader and investor and no liability will be accepted by the authors, Sharetradingeducation.com, trade2win.com, Avestra Capital, their agents or other contributors. So what are the consequences of not developing and sticking to your Trading Plan? We warn that you will probably lose overall - and maybe lose in a big way………. ……… It’s only a matter of time. Without a structured Plan, sooner or later you may change from being a conservative investor to trying to ‘overplay’ the fast track of speculative or leveraged trading …….. or may be overexposed in one sector…… or be holding too many positions …….. or too large a position ……and the market suddenly turns or, worse still, crashes. Or maybe you will ignore your stop losses (if you’ve set them in the first place) and go into the BHP approach (Buy, Hope and Pray). Or maybe you will listen, as we did at the start of the tech stock crash in 2000, to a licensed broker at a large Institution who advised us: “It’s not a loss unless you sell it” and “If it’s broken today, it’s fixed tomorrow” (meaning wait for prices to “come back”) and “Sell anything that’s even money or better” - which means you end up selling your best performing stocks and holding on to your losers. I apologize for being brutally honest, but my reason is to help save you from yourself. Believe me it can happen. It did happen…… as a result …… after doubling on paper a large portfolio in only six months, we then lost our Sydney Harbour waterfront home in 2000 and were set back over 15 years financially …… plus terrifying emotional turmoil and stress at that time and later. I therefore write from real life experience in the school of hard knocks of knowing now that if we had developed even a simple Trading Plan and had stuck to it with discipline - then we would not have been set back financially over fifteen years - let alone the emotional terror and distress experienced personally and by our family. Disclaimer: Direct investing in the stock market can result in financial loss. Historical results are no guarantee of future returns. No representation is being made that any account will or is likely to achieve profits or losses similar to those shown. Stock tips or ‘buy’ or sell recommendations are not provided. This educational information is not designed to replace your Licensed Financial Consultant or your Stockbroker. It has been prepared without regard to any particular person's investment objectives, financial situation and particular needs. This information is of a general nature only so you should seek advice from your broker or other investment advisors as appropriate before taking any action. The decision to trade and the method of trading is for the reader alone to decide. Avestra Securities Pty Ltd (Avestra) AFSL 292464, and ShareTradingEducation.com (“STE”), as Corporate Authorized Representative of Avestra, disclaims all liability of Avestra, STE and its Associates for any loss or damage suffered by any person by reason of the use by that person of, or their reliance on any information contained herein, whether arising from the negligence of Avestra, STE or its Associates or otherwise. Refer also to the full disclaimer at the back of each newsletter Edition and our Terms of Use. 13 How to Write Your Own Stock & Futures Trading Plan Copyright© 2008 Tim Wilcox, Jim Berg, John Atkinson & Sharetradingeducation.com So it is with the utmost conviction that I now urge you to not only read this ebook, but then to take the time to sit down and actively create your own Trading Plan. Build it step-by-step using this Template, together with any other information you may have accumulated. Take your time. Believe me it will be worth your effort. research time you ever spend in the market. It will probably be the most valuable Some housekeeping before we begin. In his original document, Tim referred to ‘traders’. For the purpose of this ebook we freely interchange the words ‘trader’ and ‘investor’ and the words ‘stocks’ and ‘shares’. We have deliberately kept the main structure of this ebook to follow that of Tim Wilcox’ original valuable work. This includes keeping Tim’s original question numbers as a basis, although we’ve added some extra sections e.g. to Question 12 in Chapter 7. To help readers easily find other resources, hyperlinks are provided within this document. Simply click on the links for further information. Also, at the back of this ebook are links to hidden web pages where readers may obtain significant newsletter member discounts on Jim Berg’s trading tools - at www.sharetradingeducation.com In the following chapters, Tim Wilcox’s suggested answers are prefixed ‘TW’ and are shown in italics. Jim Berg’s answers are prefixed ‘JB’ and are shown in blue. Questions on topics covered in this ebook may be directed to Tim Wilcox at his thread at http://www.trade2win.com/boards/showthread.php?t=12585 Questions on the market in general, can be directed to Jim Berg in the dedicated ‘Ask Jim Berg’ section at the www.sharescene.com forum. The authors hope you find this ebook of help in your own trading and investing in the market. They look forward to your feedback at the Trade2Win.com and ShareScene.com forums respectively. Trade what you see, not what you feel John Atkinson# November 2008 www.sharetradingeducation.com ______________________________________________________________________________ # John Atkinson is the Co-editor, with Jim Berg, of the popular Investing & Online Trading stock market newsletter. He is also the author of 2 ebooks, the ‘Atkinson-Guppy Articles’ and co-authored ‘7 Secrets to Profitable Online Stock & Share Trading’, compilations of some enlightening articles which John has written for Daryl Guppy’s newsletter ‘Tutorials in Applied Technical Analysis (www.guppytraders.com). From his real life experience, John has also designed the Atkinson Money & Risk Management Portfolio Tools. . Disclaimer: Direct investing in the stock market can result in financial loss. Historical results are no guarantee of future returns. No representation is being made that any account will or is likely to achieve profits or losses similar to those shown. Stock tips or ‘buy’ or sell recommendations are not provided. This educational information is not designed to replace your Licensed Financial Consultant or your Stockbroker. It has been prepared without regard to any particular person's investment objectives, financial situation and particular needs. This information is of a general nature only so you should seek advice from your broker or other investment advisors as appropriate before taking any action. The decision to trade and the method of trading is for the reader alone to decide. Avestra Securities Pty Ltd (Avestra) AFSL 292464, and ShareTradingEducation.com (“STE”), as Corporate Authorized Representative of Avestra, disclaims all liability of Avestra, STE and its Associates for any loss or damage suffered by any person by reason of the use by that person of, or their reliance on any information contained herein, whether arising from the negligence of Avestra, STE or its Associates or otherwise. Refer also to the full disclaimer at the back of each newsletter Edition and our Terms of Use. How to Write Your Own Stock & Futures Trading Plan Copyright© 2008 Tim Wilcox, Jim Berg, John Atkinson & Sharetradingeducation.com 14 Glossary of Terms The following is an abbreviated Glossary of Terms to explain the terminology used on Jim Berg’s charts, drawn using JB Premium Charts. Rising Market – Weekly Chart. Prices making higher highs and higher lows and the close is above a rising moving average. Relative Strength Index (RSI) - RSI compares the average of rising price change to falling price change over a specified period. Traders might use RSI to determine trend, momentum, divergence or overbought and oversold areas. Average True Range (ATR) - ATR measures volatility by averaging price ranges over a set time period while taking into account trading gaps. The True Range indicator is defined as the greatest of the following for each period: The distance from today's high to today's low. The distance from yesterday's close to today's high. The distance from yesterday's close to today's low. The Average True Range is the average of the true ranges over the past x periods, where x is specified by the user. Initial Stop – We purchase stocks when we believe they will rise in value. We do not want to own them if their price declines. The Initial Stop is the point at which we decide to exit a position. This stop is calculated before entering the trade and is designed to keep losses to a minimum. One close below the Initial Stop is an exit signal. Jim Berg’s Volatility Trailing Stop – A trailing stop is used to protect profits and replaces the Initial Stop once prices have moved up sufficiently. The trailing stop used in this newsletter is based on Average True Range (see above). Two consecutive closes below the Trailing Stop is an exit signal. Jim Berg’s Blue Bar Entry Signal – A volatility based indicator which changes the colour of the daily bars from red to blue when prices have moved sufficiently up from a significant recent lowest price. Berg Profit Taker – A Jim Berg indicator used in the short-term trading portfolio. Stock prices often move too far too fast, offering a profit taking opportunity. A close above the JB Profit Taker, with a profit of at least 10%, is an exit signal. A FREE full ‘Glossary of Terms’ ebook may be downloaded by registering/logging in at our Free Downloads Section at www. sharetradingeducation.com. Jim Berg’s JB Volatility Indicators and Watch Lists are part of the JB Premium Charts & data package, which, together with ‘Trading Strategies with JB Premium Charts’ form part of his complete JB Combo. Also, for Metastock Users, Jim’s Volatility Entry Metastock Advisor & Explorations form the basis of his Metastock Volatility Charting Template, which is also included as part of his Home Study Course – ‘Trading Strategies with Metastock’. Disclaimer: Direct investing in the stock market can result in financial loss. Historical results are no guarantee of future returns. No representation is being made that any account will or is likely to achieve profits or losses similar to those shown. Stock tips or ‘buy’ or sell recommendations are not provided. This educational information is not designed to replace your Licensed Financial Consultant or your Stockbroker. It has been prepared without regard to any particular person's investment objectives, financial situation and particular needs. This information is of a general nature only so you should seek advice from your broker or other investment advisors as appropriate before taking any action. The decision to trade and the method of trading is for the reader alone to decide. Avestra Securities Pty Ltd (Avestra) AFSL 292464, and ShareTradingEducation.com (“STE”), as Corporate Authorized Representative of Avestra, disclaims all liability of Avestra, STE and its Associates for any loss or damage suffered by any person by reason of the use by that person of, or their reliance on any information contained herein, whether arising from the negligence of Avestra, STE or its Associates or otherwise. Refer also to the full disclaimer at the back of each newsletter Edition and our Terms of Use. How to Write Your Own Stock & Futures Trading Plan Copyright© 2008 Tim Wilcox, Jim Berg, John Atkinson & Sharetradingeducation.com 15 CHAPTER 1 Trading Plan Overview By Tim Wilcox • What Is a Trading Plan? • Who needs a Trading Plan? • What Will a Trading Plan Do? • Before you Start Disclaimer: Direct investing in the stock market can result in financial loss. Historical results are no guarantee of future returns. No representation is being made that any account will or is likely to achieve profits or losses similar to those shown. Stock tips or ‘buy’ or sell recommendations are not provided. This educational information is not designed to replace your Licensed Financial Consultant or your Stockbroker. It has been prepared without regard to any particular person's investment objectives, financial situation and particular needs. This information is of a general nature only so you should seek advice from your broker or other investment advisors as appropriate before taking any action. The decision to trade and the method of trading is for the reader alone to decide. Avestra Securities Pty Ltd (Avestra) AFSL 292464, and ShareTradingEducation.com (“STE”), as Corporate Authorized Representative of Avestra, disclaims all liability of Avestra, STE and its Associates for any loss or damage suffered by any person by reason of the use by that person of, or their reliance on any information contained herein, whether arising from the negligence of Avestra, STE or its Associates or otherwise. Refer also to the full disclaimer at the back of each newsletter Edition and our Terms of Use. How to Write Your Own Stock & Futures Trading Plan Copyright© 2008 Tim Wilcox, Jim Berg, John Atkinson & Sharetradingeducation.com CHAPTER 1. 16 TRADING PLAN OVERVIEW 1. What is a Trading Plan? 1.1 A trading plan is a complete set of rules that covers every aspect of your investing and trading life. Many experts refer to the need to have an ‘edge’ which will tip the balance of probabilities of success in your favour. In itself, a plan is not an edge but, over time, the investor with a plan will fair a lot better than the investor without one. Many amateur investors do not have any sort of plan to trade by, and enter the markets with scant regard to their risk and profit objectives. Suffice to say, comprehensive risk and money management strategies lie at the heart of all good trading plans. 1.2 Investors with a plan have the ability to monitor their performance. They can evaluate their progress continually, day-by-day, in a way that is objective and comprehensive. This enables them to invest without emotion and with minimal stress. The investor without a plan is not able to do this and their investing tends to rely upon gut feeling, hunches and tips etc. Investing for them is a nail biting, emotional roller coaster ride of stress that, inevitably, results in financial loss. 1.3 Obviously, a plan does not guarantee success; that would be too simple. However, a good plan that is adhered to strictly will help to minimise losses and enable you to stay in the game a lot longer than investors who do not have a plan. In his book ‘trading online’, Alpesh B. Patel writes, “While a plan cannot predict the future, it can lay down how you react to the possible outcomes. This is why a plan is essential. It is a list of strategic responses to events beyond your control. You control the only thing you can control – yourself”. 1.4 Some confusion exists over the difference between a trading plan (or system) and a trading strategy. As stated above, the former is a complete set of rules that governs every aspect of your investing life. It goes into great detail and may, for example, stipulate the amount of time devoted to reading threads on forums such as T2W (or Sharescene.com or Stockmeetingplace.com)! The term ‘trading strategy’ tends to be used to describe trade entry and exit criteria. However, these are merely elements of an overall trading plan and possibly not even the most important ones. It is perfectly feasible, desirable even, to include two or more trading strategies (i.e. entry and exit criteria) within an overall trading plan. 2. Who Needs a Trading Plan? 2.1 Who needs a trading plan? Well, unless you have been a consistently profitable investor over a sufficient length of time to encompass a number of different market conditions, then YOU need a trading plan! Disclaimer: Direct investing in the stock market can result in financial loss. Historical results are no guarantee of future returns. No representation is being made that any account will or is likely to achieve profits or losses similar to those shown. Stock tips or ‘buy’ or sell recommendations are not provided. This educational information is not designed to replace your Licensed Financial Consultant or your Stockbroker. It has been prepared without regard to any particular person's investment objectives, financial situation and particular needs. This information is of a general nature only so you should seek advice from your broker or other investment advisors as appropriate before taking any action. The decision to trade and the method of trading is for the reader alone to decide. Avestra Securities Pty Ltd (Avestra) AFSL 292464, and ShareTradingEducation.com (“STE”), as Corporate Authorized Representative of Avestra, disclaims all liability of Avestra, STE and its Associates for any loss or damage suffered by any person by reason of the use by that person of, or their reliance on any information contained herein, whether arising from the negligence of Avestra, STE or its Associates or otherwise. Refer also to the full disclaimer at the back of each newsletter Edition and our Terms of Use. How to Write Your Own Stock & Futures Trading Plan Copyright© 2008 Tim Wilcox, Jim Berg, John Atkinson & Sharetradingeducation.com 17 If you have achieved this, then this document may not tell you anything you do not already know. However it may still prove useful as a “refresher” course or indeed open your eyes to new aspects of trading that can improve your profitability. 2.2 Some people have described a trading plan as a roadmap. It is quite literally the route that will take you from where you are now to where you want to be which, for most traders, is consistent profitability. In this analogy, consistent profitability is the destination. To embark on a car journey from John O’Groats to Land’s End without a good roadmap would, probably, be unwise and the possible consequences of doing so are obvious. Similarly, to embark on investing in the market without a clear idea of where you are going, and how you are going to get there, will almost certainly result in increased stress, sleepless nights and financial loss - or all three. The question you must ask yourself is this: if you would not dream of driving from the north of Scotland to the most southerly tip of England without a detailed roadmap, why on earth have you not got a detailed and clearly laid out trading plan? 3. What Will a Trading Plan Do? 3.1 A trading plan will make the act of investing simpler than it would be if you invested without one. It will limit your opportunity to make bad trades and it will prevent many psychological issues from taking root. It will help you to achieve these things because wherever you are on your investing journey, it will not only act as a roadmap, but also locate your position as well. Most importantly, if your investing is going badly, you will know it is down to one of only two possibilities: either something in the plan is not working or you are not adhering to the plan. If the plan is a good one and it is back tested and paper traded, (or forward tested with a very small amount of money) then the fault is likely to be found in the latter of the two options. But, what if you are losing money whilst investing without a plan? It is virtually impossible to distinguish what you are doing right from what you are doing wrong. You have no way to evaluate your results, therefore the likelihood of being able to diagnose the fault and correct it is small and could take forever. A trading plan is your personal GPS device to locate your position and, if you have made a wrong turn, it provides the means to identify where you went wrong and how to get back on track. You are able to evaluate continually your results and, more importantly - your discipline - in a manner that is objective and comprehensive. This is extremely difficult to do if you do not have a plan. 3.2 A trading plan should take away much of the decision making in the heat of the moment. Emotional issues will become very powerful when real money is on the line and, as likely as not, force you into making irrational decisions. With the correct trading plan, your every action should be spelled out, so that in the heat of the moment you do not have to make any decisions, you just follow what the trading plan stipulates. Disclaimer: Direct investing in the stock market can result in financial loss. Historical results are no guarantee of future returns. No representation is being made that any account will or is likely to achieve profits or losses similar to those shown. Stock tips or ‘buy’ or sell recommendations are not provided. This educational information is not designed to replace your Licensed Financial Consultant or your Stockbroker. It has been prepared without regard to any particular person's investment objectives, financial situation and particular needs. This information is of a general nature only so you should seek advice from your broker or other investment advisors as appropriate before taking any action. The decision to trade and the method of trading is for the reader alone to decide. Avestra Securities Pty Ltd (Avestra) AFSL 292464, and ShareTradingEducation.com (“STE”), as Corporate Authorized Representative of Avestra, disclaims all liability of Avestra, STE and its Associates for any loss or damage suffered by any person by reason of the use by that person of, or their reliance on any information contained herein, whether arising from the negligence of Avestra, STE or its Associates or otherwise. Refer also to the full disclaimer at the back of each newsletter Edition and our Terms of Use. How to Write Your Own Stock & Futures Trading Plan Copyright© 2008 Tim Wilcox, Jim Berg, John Atkinson & Sharetradingeducation.com 18 3.3 Okay, I hope you are now totally sold on the merits of having a detailed and clearly laid out trading plan. Here is a summary of what the key benefits are: Relaxed, stress free investing that is simpler with a plan than it is without one Ability to monitor your progress, diagnose faults and amend the plan accordingly A plan helps to prevent many psychological issues from taking root A plan that is adhered to strictly will reduce the number of bad trades A plan will help prevent irrational decisions in the heat of the moment A plan enables you to control the only thing you can control - yourself Professional investors and traders are highly disciplined. A plan will instill a large measure of discipline into your trading. Gamblers tend to lack both discipline and a plan A plan will enable you to trade outside your comfort zone. How many times have you let a loss run and cut a profit short because it was the comfortable thing to do? A plan, executed with discipline, will help to prevent this from happening A plan is your roadmap which will enable you to get from wherever you are now to wherever you want to be – i.e. consistent profitability The template (and, by implication, your plan) – is designed in such a way that if you do take a ‘wrong turn’ on your roadmap, you will know about it very quickly and have the opportunity to correct the problem before losses spiral out of control . 4. Before You Start . . . 4.1 Before you start to create your own trading plan using the template, here are a few pointers to help ensure that you build the best plan possible. The template is broken down into eleven units. The objective of the exercise is to end up with a plan that is tailor made to suit your personality, ability and resources. Do not be tempted to skip any sections and be sure to work through them in the order that they appear. The order is specific for reasons that should become clear in due course. Think of the eleven units as links in a chain or as individual players in a football team; each one is as important as the other. For those of you who enjoy analogies such as these and wonder which unit best equates to the ‘goalie’, the answer is unit ten, ‘Risk & Money Management’. 4.2 Quite a few of the units may seem beguilingly simple. Although the template is designed to be as simple as possible, be sure to give careful consideration to all your answers. For example, the first unit poses the question, why do you want to be an investor? “To make money”, is a generic answer that is applicable to all investors. It is not personal to you and, therefore, it is not helpful to your plan. ‘Investing is a business, just like any other’, is a cliché that is often quoted and one that is all too easy to forget. You might enjoy a cappuccino from time to time, but chances are that you would not dream of taking up a Starbucks franchise - so why become an investor or a trader? Disclaimer: Direct investing in the stock market can result in financial loss. Historical results are no guarantee of future returns. No representation is being made that any account will or is likely to achieve profits or losses similar to those shown. Stock tips or ‘buy’ or sell recommendations are not provided. This educational information is not designed to replace your Licensed Financial Consultant or your Stockbroker. It has been prepared without regard to any particular person's investment objectives, financial situation and particular needs. This information is of a general nature only so you should seek advice from your broker or other investment advisors as appropriate before taking any action. The decision to trade and the method of trading is for the reader alone to decide. Avestra Securities Pty Ltd (Avestra) AFSL 292464, and ShareTradingEducation.com (“STE”), as Corporate Authorized Representative of Avestra, disclaims all liability of Avestra, STE and its Associates for any loss or damage suffered by any person by reason of the use by that person of, or their reliance on any information contained herein, whether arising from the negligence of Avestra, STE or its Associates or otherwise. Refer also to the full disclaimer at the back of each newsletter Edition and our Terms of Use. How to Write Your Own Stock & Futures Trading Plan Copyright© 2008 Tim Wilcox, Jim Berg, John Atkinson & Sharetradingeducation.com 19 4.3 In answer to the question in 4.2 above, it may be that you have seen pit traders in garish jackets on television and thought to yourself ‘I would just love to be that fired up and passionate about what I do’. If so, you may have a need for excitement. Ordinarily, such a desire is an admirable one but, in the markets, it could easily lead to catastrophe if allowed to go unchecked. Perhaps you have heard stories about traders making tens of thousands in a single day? Without doubt, some do; but they are only a small fraction of the mere 5% of traders who, so it is alleged, make any money at all in the markets. Crushing disappointment is often the reward for unbridled greed. Pie in the sky fantasies about trading via a laptop while aboard a luxury yacht, sipping champagne in the Bahamas, are great fun, but they are hardly grounded in reality. Such fantasies may help to motivate you to study the markets, but the emotions that accompany them may not help you when it comes to investing in the markets. Just as the trader with a lust for excitement is doomed to fail, the fate of an investor motivated by greed is almost certain to lead to disaster. 4.4 Having these thoughts and emotions is not the problem; it is how you control them while you are trading that is the problem. Think very carefully about these questions and be brutally honest with yourself. Do not pretend to be someone you are not because you are embarrassed to commit pen to paper and admit that you are a thrill seeker chasing the Holy Grail of easy money. That is okay, after all, a good percentage of the 32,000+ members of T2W started out that way! In answering the question about why you want to invest in the market, you will uncover the real motivations, fears and desires that fuel your ambition. Some of these will be helpful whilst investing, others not. How you allow them to impact your investing is what this document is, to a large extent, all about. To ensure that the impact is a profitable one, you must start by examining your real reasons for investing and, hopefully, learn more about yourself in the process. 4.5 Each unit comprises a series of questions (in bold type, like this) followed by a few sentences (in normal text, like this) to explain the question in more detail. Then there is a basis for an answer (in italics, like this#) to provide further clarification. The latter is intended as a guide only and is not meant to constrain your thoughts and ideas in any way. 4.6 All your answers to the questions must be clear and succinct. There is no room for ambiguity in your plan; so avoid vague, fuzzy statements. Also, where possible, always define and qualify your statements. This usually means posing the questions - what, when, where, why or how. For example, suppose you swing trade the Dow Jones 30 Index. Why the DOW and not the FTSE 100? Because you want to trade in the evenings, after work? Okay, fair play. How will you ensure your success? Ah, you will start by writing a trading plan? Excellent! When will you write it? You get the general idea. Disclaimer: Direct investing in the stock market can result in financial loss. Historical results are no guarantee of future returns. No representation is being made that any account will or is likely to achieve profits or losses similar to those shown. Stock tips or ‘buy’ or sell recommendations are not provided. This educational information is not designed to replace your Licensed Financial Consultant or your Stockbroker. It has been prepared without regard to any particular person's investment objectives, financial situation and particular needs. This information is of a general nature only so you should seek advice from your broker or other investment advisors as appropriate before taking any action. The decision to trade and the method of trading is for the reader alone to decide. Avestra Securities Pty Ltd (Avestra) AFSL 292464, and ShareTradingEducation.com (“STE”), as Corporate Authorized Representative of Avestra, disclaims all liability of Avestra, STE and its Associates for any loss or damage suffered by any person by reason of the use by that person of, or their reliance on any information contained herein, whether arising from the negligence of Avestra, STE or its Associates or otherwise. Refer also to the full disclaimer at the back of each newsletter Edition and our Terms of Use. How to Write Your Own Stock & Futures Trading Plan Copyright© 2008 Tim Wilcox, Jim Berg, John Atkinson & Sharetradingeducation.com 20 CHAPTER 2 YOU AND YOUR GOALS By Tim Wilcox & Jim Berg • Purpose • Personal Attributes • Goals and ambitions Disclaimer: Direct investing in the stock market can result in financial loss. Historical results are no guarantee of future returns. No representation is being made that any account will or is likely to achieve profits or losses similar to those shown. Stock tips or ‘buy’ or sell recommendations are not provided. This educational information is not designed to replace your Licensed Financial Consultant or your Stockbroker. It has been prepared without regard to any particular person's investment objectives, financial situation and particular needs. This information is of a general nature only so you should seek advice from your broker or other investment advisors as appropriate before taking any action. The decision to trade and the method of trading is for the reader alone to decide. Avestra Securities Pty Ltd (Avestra) AFSL 292464, and ShareTradingEducation.com (“STE”), as Corporate Authorized Representative of Avestra, disclaims all liability of Avestra, STE and its Associates for any loss or damage suffered by any person by reason of the use by that person of, or their reliance on any information contained herein, whether arising from the negligence of Avestra, STE or its Associates or otherwise. Refer also to the full disclaimer at the back of each newsletter Edition and our Terms of Use. How to Write Your Own Stock & Futures Trading Plan Copyright© 2008 Tim Wilcox, Jim Berg, John Atkinson & Sharetradingeducation.com 21 CHAPTER 2. YOU & YOUR GOALS 5. Know Yourself, Know Your Purpose 5.1 Almost any professional trader or investor will tell you that the key to success in the markets lies in understanding your own psyche. (Understanding the psyche of fellow traders, collectively referred to as ‘sentiment’, is also an invaluable tool). Many inexperienced traders are unprepared for the violent assault on their thoughts and emotions at the start of their careers. They soon find their heads spinning with euphoria when winning (greed) and the pits of their stomachs knotted with anxiety when losing (fear). Contrast this with many professional traders who, it is said, achieve a sort of trading nirvana, whereby their thoughts and emotions blend into a sea of calm regardless of whether they are winning or losing. Their heads do not spin and their stomachs do not churn – ever. For you to achieve this exalted state, you will need to know yourself and how you will react to both winning and losing positions. Once armed with this information, your trading plan can incorporate some of the positive aspects of your psychological make-up and filter out some of its negative aspects. 5.2 Coupled with understanding your own psyche it is important to know why it is that you want to be an investor. What is your purpose - what does success as an investor mean to you? Decide what it is that you want to achieve and then ask why and how trading is going to provide it. How sad it would be if, after a year or more and hundreds if not thousands of pounds/dollars later, you realised that trading was not for you after all and that the ladder to success was leaning up against the wrong wall. Okay, here goes – your very own trading plan starts now. 5.3 Why do You Want to be an Investor or Trader? Question your true motivations. Examine whether your talents would be better suited to another business like the Starbucks franchise mentioned earlier. Are you certain that trading is the right business for you? If you believe that the markets exist for the sole purpose of showering you in vast quantities of easy money – then think again! Beware: it is NOT the easy option! TW: I want to be an investor because . . . (I am excited by the challenge to be successful in a discipline that is notoriously difficult and where, allegedly, 90% of participants fail). My primary objective in wanting to be a trader is to . . . (generate sufficient annual income of £/$______ in order to support my family). My secondary objective is to . . . (spend more time with my family and enjoy the freedom of being able to trade from anywhere in the world). These objectives are important to me because . . . (they provide purpose and direction to my life and enable me to lead a more balanced one). I believe I can achieve my objectives because . . . (my name is Larry Williams - say no more!) JB: I want to be a successful trader because of the life style. As I use weekly and end of day data I enjoy the freedom to have the time to take part in many experiences during the day without having to report to a ‘boss’. I also like the flexibility of working from home or being able to trade from anywhere else in the world. My primary objective is to provide for a comfortable retirement. Disclaimer: Direct investing in the stock market can result in financial loss. Historical results are no guarantee of future returns. No representation is being made that any account will or is likely to achieve profits or losses similar to those shown. Stock tips or ‘buy’ or sell recommendations are not provided. This educational information is not designed to replace your Licensed Financial Consultant or your Stockbroker. It has been prepared without regard to any particular person's investment objectives, financial situation and particular needs. This information is of a general nature only so you should seek advice from your broker or other investment advisors as appropriate before taking any action. The decision to trade and the method of trading is for the reader alone to decide. Avestra Securities Pty Ltd (Avestra) AFSL 292464, and ShareTradingEducation.com (“STE”), as Corporate Authorized Representative of Avestra, disclaims all liability of Avestra, STE and its Associates for any loss or damage suffered by any person by reason of the use by that person of, or their reliance on any information contained herein, whether arising from the negligence of Avestra, STE or its Associates or otherwise. Refer also to the full disclaimer at the back of each newsletter Edition and our Terms of Use. How to Write Your Own Stock & Futures Trading Plan Copyright© 2008 Tim Wilcox, Jim Berg, John Atkinson & Sharetradingeducation.com 22 My secondary objective is to supplement current yearly income. These objectives are important to me because they give me the opportunity to spend extended time with my families in both Australia and the U.S. I believe I can achieve these objectives because of my experience in developing a Trading Plan and the discipline to follow it without fail. 5.4 What Sort of Trader or Investor are You? Are you a discretionary trader or a mechanical one? Do you propose to invest in trades in the longterm (i.e. months), medium-term (i.e. weeks) or short-term (i.e. days or, even, intra-day)? The choice of position trader, swing trader or day trader will, to a large extent, be determined by the amount of time you are able to devote to your business. Generally speaking, day traders remain glued to their monitors throughout the duration of every trade, whilst position traders may devote as little as one hour a week to the markets. Define your investing or trading style and examine your beliefs about the markets. TW: I am a discretionary investor and my style is very . . . (aggressive - which makes me suited to scalping intraday or, alternatively, conservative – which makes me suited to swing trading end of day (E.O.D.)). I understand that I cannot predict the future and I accept that I cannot control the markets. However I can control myself, which I will do by . . . (adhering strictly to my trading plan that is detailed, specific, tested and profitable). JB: I am a long term conservative investor using a combination of fundamental and technical analysis. I trade probability and weight-of-evidence. If a combination of fundamental and technical criteria produced a high percentage of successful trades historically, then the potential is that they will do so again in the future. I combine the strengths of each analysis to compensate for their shortcomings and produce a “common sense” approach to investing. A modest success rate of 50% (half the trades result in a profit, half in a loss) and an average profit/loss ratio of 2:1 means I will grow my portfolio well. A profit/loss ratio of 2:1 means every $1 you lose on bad trades is offset by a gain of $2 on the good trades. As with all successful trading strategies, disciplined position management and defined risk controls are an important part of my trading plan. 5.5 What are Your Strengths and Weaknesses? List each of your investing strengths and weaknesses and then specify how you will maximise the benefit of the former and minimize the damage caused by the latter. This is often easier to do for other people than it is to do for yourself. Your background may provide some clues. Suppose you are an ex-fighter pilot who is used to working in a highly disciplined environment and adhering to a set of very strict procedures. (Potential strength). Disclaimer: Direct investing in the stock market can result in financial loss. Historical results are no guarantee of future returns. No representation is being made that any account will or is likely to achieve profits or losses similar to those shown. Stock tips or ‘buy’ or sell recommendations are not provided. This educational information is not designed to replace your Licensed Financial Consultant or your Stockbroker. It has been prepared without regard to any particular person's investment objectives, financial situation and particular needs. This information is of a general nature only so you should seek advice from your broker or other investment advisors as appropriate before taking any action. The decision to trade and the method of trading is for the reader alone to decide. Avestra Securities Pty Ltd (Avestra) AFSL 292464, and ShareTradingEducation.com (“STE”), as Corporate Authorized Representative of Avestra, disclaims all liability of Avestra, STE and its Associates for any loss or damage suffered by any person by reason of the use by that person of, or their reliance on any information contained herein, whether arising from the negligence of Avestra, STE or its Associates or otherwise. Refer also to the full disclaimer at the back of each newsletter Edition and our Terms of Use. How to Write Your Own Stock & Futures Trading Plan Copyright© 2008 Tim Wilcox, Jim Berg, John Atkinson & Sharetradingeducation.com 23 However, the flip side of the coin is that you may also have a need for fun, or an addiction to adrenalin pumping, nail biting excitement or, even, a subconscious desire to experience fear. (Potential weakness). If you are struggling to answer this question, try paper trading for a while and examine each trade, noting what you did right and what you did wrong. Do this until a pattern starts to emerge which should reveal your strengths and weaknesses to you. TW: My primary strength is . . . (allowing my profits to run and closing trades in accordance with my exit strategy. This contributes to ‘my edge’ and helps me towards my goal of being consistently profitable in the markets). My secondary strength is . . . My primary weakness is . . . (wanting to recoup a loss quickly which, almost inevitably, results in increased losses). The following aspect of my trading plan will help to control this weakness and prevent losses from spiralling out of control . . . (I have a pre-defined daily stop. If it is hit, I stop trading for the day). My secondary weakness is . . . JB: Strengths: Detailed Trading Plan Discipline to Follow the Plan Not Affected by Market Noise (Price Fluctuations) Not Affected by Media Noise (Journalists & Gurus) Never “Loved” a Company –I do not become ‘married’ to any position and hold on to it regardless. I will trade out of anything without attachment or remorse. If it triggers my exit signal according to my rules, then I exit. Never “Beat Myself Up” After Exiting a Trade – many novice traders monitor a company’s share price, after selling it, to see how it performs. They want confirmation they made the right decision and often “punish” themselves with grief and future indecision as a result. If you followed the “rules”, let it go and get on with the next trade. Never “Trade What I Feel” – One of the worse things that can happen to a beginning trader is to have a successful trade based on feeling. It means the trader gets “positive feedback” for breaking the rules and will likely trade that “feeling” again. It usually doesn’t take novice traders long to realize “if you trade what you feel, you will lose your money” Weaknesses: ¾ Too Conservative – limit returns. ¾ Looking at shorter term time frames and trading other securities. 5.6 Are You in the Right Frame of Mind to Invest? Disclaimer: Direct investing in the stock market can result in financial loss. Historical results are no guarantee of future returns. No representation is being made that any account will or is likely to achieve profits or losses similar to those shown. Stock tips or ‘buy’ or sell recommendations are not provided. This educational information is not designed to replace your Licensed Financial Consultant or your Stockbroker. It has been prepared without regard to any particular person's investment objectives, financial situation and particular needs. This information is of a general nature only so you should seek advice from your broker or other investment advisors as appropriate before taking any action. The decision to trade and the method of trading is for the reader alone to decide. Avestra Securities Pty Ltd (Avestra) AFSL 292464, and ShareTradingEducation.com (“STE”), as Corporate Authorized Representative of Avestra, disclaims all liability of Avestra, STE and its Associates for any loss or damage suffered by any person by reason of the use by that person of, or their reliance on any information contained herein, whether arising from the negligence of Avestra, STE or its Associates or otherwise. Refer also to the full disclaimer at the back of each newsletter Edition and our Terms of Use. How to Write Your Own Stock & Futures Trading Plan Copyright© 2008 Tim Wilcox, Jim Berg, John Atkinson & Sharetradingeducation.com 24 Your mindset is the key obstacle that lies between you and success in the markets. Have you slept well; are you fit, healthy and mentally alert? Are you calm and relaxed or are you tired and distracted by other events in your life? TW: I will only open new trades on days when . . . (I am rested, relaxed and not distracted by work or family etc. I will be guided by my trading plan and I will adhere to it rigidly. It will help to prevent me from making trades that are poorly conceived and executed; i.e. trades that are based on gut feeing and motivated by fear and/or greed). I will not trade on days when . . . (I am feeling off colour, hung over, particularly tired or when I am mentally distracted by other events in my life). JB: Trading weekly charts reduces the daily stress and tension that can be caused by following the markets too closely. It also means I do not have to sit in front of a trading screen intraday. Rather, I make my decisions in the calm of night after the market has closed. As a result, I then have the time and freedom to enjoy activities I choose, which in turn puts me in a better frame of mind to invest. 5.7 What are Your Income Targets? There are numerous reasons for becoming an investor; making money is the one reason that unites us all. It is important to know your financial targets and to break them down into daily/weekly bite size chunks. The old adage ‘by the inch it’s a cinch - by the yard it’s hard’, certainly applies to investors. Needless to say, if your strategies generate 5% a month, it is counter productive to have a target of 1% per day. Your targets are not idle fantasies, they must be based upon your back and forward testing results. (This is expanded upon in sections 10.7 and 10.8, in which we examine the ‘Success’ ratio and the ‘Sharpe’ ratio). TW: My financial targets are . . . (to achieve a return of X% per year, which equates to an annual income of £/$______ without the drawdown on my account exceeding a maximum of Y%. This equates to an average monthly income of £/$_____, an average weekly income of £/$____ and an average daily income of £___. Therefore, I have a daily target of Z% of my total equity). JB: If I quoted a certain figure, no doubt some novices would feel that it is out of reach of their comprehension right now. In contrast, some other more experienced traders may consider my figures too conservative. The important aspect here is that we each need to document our own personal and realistic income targets, based on our own lifestyle, personality, skill, knowledge base and starting capital. Disclaimer: Direct investing in the stock market can result in financial loss. Historical results are no guarantee of future returns. No representation is being made that any account will or is likely to achieve profits or losses similar to those shown. Stock tips or ‘buy’ or sell recommendations are not provided. This educational information is not designed to replace your Licensed Financial Consultant or your Stockbroker. It has been prepared without regard to any particular person's investment objectives, financial situation and particular needs. This information is of a general nature only so you should seek advice from your broker or other investment advisors as appropriate before taking any action. The decision to trade and the method of trading is for the reader alone to decide. Avestra Securities Pty Ltd (Avestra) AFSL 292464, and ShareTradingEducation.com (“STE”), as Corporate Authorized Representative of Avestra, disclaims all liability of Avestra, STE and its Associates for any loss or damage suffered by any person by reason of the use by that person of, or their reliance on any information contained herein, whether arising from the negligence of Avestra, STE or its Associates or otherwise. Refer also to the full disclaimer at the back of each newsletter Edition and our Terms of Use. How to Write Your Own Stock & Futures Trading Plan Copyright© 2008 Tim Wilcox, Jim Berg, John Atkinson & Sharetradingeducation.com 25 So, as this document will be in the public arena, I trust you will understand why I prefer to keep my own income targets confidential. In our newsletter we select stocks for the notional short term trading portfolio which uses my proven strategies, incorporating Fundamental and Technical Analysis combined. In Question 12.6 we detail my Short Term rules which we developed for that portfolio. We received a letter once from a Funds Management company headlined “If you didn’t earn 5.6% pa on your savings in recent months, then perhaps, just this once, you should”. Needless to say we were not moved to sign up. We will aim to outperform the market overall in both portfolios, as measured by the All Ords Index from the date of commencement of the Portfolio till 30 June each year and results published by Fund Managers at the end of each financial year. For example, most investors would regard a total growth in excess of 20% as a good result - and in the range of 30 to 40% would far exceed most fund managers’ expectations or performance. For the notional Short Term Trading Portfolio we take advantage of short term profit taking opportunities using the Berg Profit Taker. For longer term investors, from time to time we also show how we use virtually identical entry criteria, then manage the stocks using weekly charts, with the aim of ‘letting profits run’ for as along as the uptrend continues. The methods of searching, analysis, selection, position sizing and stop loss management will be covered later in this Trading Plan template. In our newsletter we provide practical examples of notional short term trades each week for educational purposes. These trades often last for about a month on average. They are not stock tips, ‘buy’ or ‘sell’ recommendations. In addition, we may add a strategy of using Share Purchase Plans (SPP) for part of our notional Short Term Trading Portfolio. For instance, in their weekly newsletter to their clients on Friday 22 July 2005, one Sydney broker reported for their notional portfolio: “For the 04/05 financial year, the SPP Portfolio returned 37% on the $20,000 invested. We held $8,000 in cash for the year, and have therefore reduced our initial investment amount down to $12,000. Had we invested $12,000 in 04/05, the return would have been 54%. This is mentioned here as an example only and comes with the proviso that we emphasize there is no guarantee that past performance will be repeated in the market. The full details of using the Share Purchase Plan strategy, including how to filter for which ones to select and the timing of when to buy, are as published in John Atkinson's ebook, The AtkinsonGuppy Articles. This ebook includes a joint article by Rod Harper and John Atkinson, as released originally in Daryl Guppy’s newsletter (www.guppytraders.com) and featured in Daryl Guppy’s latest book ‘The 36 Strategies of the Chinese for Financial Traders’. The Money & Risk Management rules which we use for the notional trades in our notional portfolio are discussed in Chapter 4. Disclaimer: Direct investing in the stock market can result in financial loss. Historical results are no guarantee of future returns. No representation is being made that any account will or is likely to achieve profits or losses similar to those shown. Stock tips or ‘buy’ or sell recommendations are not provided. This educational information is not designed to replace your Licensed Financial Consultant or your Stockbroker. It has been prepared without regard to any particular person's investment objectives, financial situation and particular needs. This information is of a general nature only so you should seek advice from your broker or other investment advisors as appropriate before taking any action. The decision to trade and the method of trading is for the reader alone to decide. Avestra Securities Pty Ltd (Avestra) AFSL 292464, and ShareTradingEducation.com (“STE”), as Corporate Authorized Representative of Avestra, disclaims all liability of Avestra, STE and its Associates for any loss or damage suffered by any person by reason of the use by that person of, or their reliance on any information contained herein, whether arising from the negligence of Avestra, STE or its Associates or otherwise. Refer also to the full disclaimer at the back of each newsletter Edition and our Terms of Use. How to Write Your Own Stock & Futures Trading Plan Copyright© 2008 Tim Wilcox, Jim Berg, John Atkinson & Sharetradingeducation.com 26 6. Trading Goals 6.1 Setting goals is an essential part of your trading plan as they provide you with a beacon to work towards, the ability to track your progress and the motivation required to get the job done. Try to define your goals in terms of your development as an investor, as opposed to purely financial goals. If you focus on becoming a proficient investor, the financial rewards are sure to follow just as night follows day. Then decide how you will achieve these goals and how you will reward yourself once you do. The rewards should reflect the scale of the achievement as well as being specific and meaningful to you. For example, the reward of a night out should name both the venue and the people you intend to take with you. 6.2 What are Your Annual Trading Goals? This is the big picture. Think in terms of the skills and knowledge that you want to acquire between now and this time next year. TW: My annual trading goal is to . . . (develop my trading ‘edge’ in order to tip the balance of probabilities in my favour. At the moment, this comprises three separate elements, namely: 1. I receive coaching from _____ ________, who is one of the best practitioners of the strategies that I employ. 2. I model the best trading practices, including having a written, clearly laid out trading plan. 3. My strategies are well developed, tested and monitored comprehensively to ensure that they remain tradable, market sensitive and profitable). I expect to achieve these goals because . . . (in addition to the coaching, I read xyz magazine and study the words of wisdom from the more experienced members of T2W). When I achieve my goal, my reward will be . . . (a two week family holiday in sun drenched Andalucia, staying in a ‘Cortijo’ with an infinity swimming pool which magically spills over into the Straights of Gibraltar, set against the stunning backdrop of the Atlas mountains of Morocco). JB: My goals are twofold – my own personal goals and those I wish to achieve by helping our readers of our newsletter survive in the market, then to become profitable. My business partner John Atkinson and I believe in the ‘win-win’, just as the famous author and motivational speaker Zig Ziglar once said “If you help enough people get what they want, then you in turn will get what you want.” Disclaimer: Direct investing in the stock market can result in financial loss. Historical results are no guarantee of future returns. No representation is being made that any account will or is likely to achieve profits or losses similar to those shown. Stock tips or ‘buy’ or sell recommendations are not provided. This educational information is not designed to replace your Licensed Financial Consultant or your Stockbroker. It has been prepared without regard to any particular person's investment objectives, financial situation and particular needs. This information is of a general nature only so you should seek advice from your broker or other investment advisors as appropriate before taking any action. The decision to trade and the method of trading is for the reader alone to decide. Avestra Securities Pty Ltd (Avestra) AFSL 292464, and ShareTradingEducation.com (“STE”), as Corporate Authorized Representative of Avestra, disclaims all liability of Avestra, STE and its Associates for any loss or damage suffered by any person by reason of the use by that person of, or their reliance on any information contained herein, whether arising from the negligence of Avestra, STE or its Associates or otherwise. Refer also to the full disclaimer at the back of each newsletter Edition and our Terms of Use. How to Write Your Own Stock & Futures Trading Plan Copyright© 2008 Tim Wilcox, Jim Berg, John Atkinson & Sharetradingeducation.com 27 I will begin by providing my responses to questions raised in this Item 6 of the Trading Plan Template in two ways. Personally, my aim is to build my Self Managed Superannuation Fund to a sufficient level so that trading produces annual income to live comfortably in two countries. The possibility of a few years of below average trading results must be taken into account in my personal Trading Plan. For our ‘Investing & Online Trading’ newsletter, our aim is to provide our readers the skills and knowledge they need to acquire to initially survive the pitfalls of the market by protecting their capital in the first place. Once we have done that, we then teach profitable trading strategies which, from my own experience, I know actually work. I have seen too many novices (and even some experienced) investors come into the market that may have had success in other ventures. Thinking they can apply their same personality and character in the market, they wonder “what happened?” when they subsequently fail. Investing in and trading the market are skills which can and must be learnt. This applies to not only in stock selection, but also developing strict Money and Risk Management rules and understanding our own and the market’s mass psychology. I share author Dr Brett Steenbarger’s view expressed to us when he wrote “If my articles can help prevent just one blow-up, I shall consider my participation most worthwhile.” 6.3 What are Your Monthly Trading Goals? Now define your monthly investing and trading goals. Again, avoid financial targets as much as possible. How will you achieve these goals and how will you reward yourself when you do? TW: My monthly trading goal is to . . . (achieve consistent profitability every month, with a Success ratio of 2:1 or more and a Sharpe ratio of 1.5:1 – or more). I expect to achieve these goals because . . . (I review my performance on a daily / weekly / monthly basis and quickly spot any problems, should they occur). When I achieve this, my rewards will be . . . (a celebratory meal out with my partner / family at the ‘New Angel’ restaurant, Dartmouth). JB: My personal goal is to continue to build the foundation for my Trading Fund. My own goals and my trading goals for our newsletter notional portfolio in particular are aligned - in that we will simply follow the rules of my trading system each week. My aim is to concentrate on remaining disciplined and focused on the tools that have worked well in the past. 6.4 What are Your Weekly Investing Goals? Time to get out the magnifying glass and zoom in on the details. Now define your weekly trading goals. How will you achieve them and how will you reward yourself when you do? Disclaimer: Direct investing in the stock market can result in financial loss. Historical results are no guarantee of future returns. No representation is being made that any account will or is likely to achieve profits or losses similar to those shown. Stock tips or ‘buy’ or sell recommendations are not provided. This educational information is not designed to replace your Licensed Financial Consultant or your Stockbroker. It has been prepared without regard to any particular person's investment objectives, financial situation and particular needs. This information is of a general nature only so you should seek advice from your broker or other investment advisors as appropriate before taking any action. The decision to trade and the method of trading is for the reader alone to decide. Avestra Securities Pty Ltd (Avestra) AFSL 292464, and ShareTradingEducation.com (“STE”), as Corporate Authorized Representative of Avestra, disclaims all liability of Avestra, STE and its Associates for any loss or damage suffered by any person by reason of the use by that person of, or their reliance on any information contained herein, whether arising from the negligence of Avestra, STE or its Associates or otherwise. Refer also to the full disclaimer at the back of each newsletter Edition and our Terms of Use. How to Write Your Own Stock & Futures Trading Plan Copyright© 2008 Tim Wilcox, Jim Berg, John Atkinson & Sharetradingeducation.com 28 TW: My weekly trading goal is to . . . (trade every day of the week in accordance with my trading plan. This will entail taking my stops instantly; sticking to my risk and money management strategies; following my exit criteria and devoting most of my time to searching for new trades and choosing only the very best setups). When I achieve this goal I will pat myself on the back by . . . (buying the digitally remastered recording of Miles Davies’ landmark album ‘Kind of Blue’). JB: The Trading Plan which I use for my Long Term Investing Portfolio is predominantly based on using weekly charts. This allows me to “get on with life” without the need for having to be a ‘screen jockey’ and watch the market intraday or trade in and out on daily ‘market noise’. By finding low volatility up trending shares which are fundamentally sound and have been ‘bought’ in the correct ‘buy zone’ according to my Trading Plan rules, I increase my probability of success. However, we know that not every trade will be profitable. Some will be unprofitable and as long as we are disciplined and cut our losses quickly, then we will progress overall. In the newsletter we will use John Atkinson’s Portfolio Management Tools to plan and manage the selections according to the strict Money & Risk Management Rules shown in Chapter 4. This will ensure that the correct risk profiles are adopted in terms of individual trade risk, sector risk and overall portfolio risk and that closed trades are analyzed to monitor our performance in terms of Dr Van Tharp’s ‘expectancy’ (refer to John Atkinson’s ebook ‘The Atkinson-Guppy Articles’) We intend to minimize and monitor very closely the risk exposure of our newsletter notional portfolio. Accordingly, we aim to have only a handful of stocks/shares in this portfolio. Once a week on a weekly basis, I review the shares selected for my own long term investing portfolio. For each, I update my stop loss levels, compare the share price at the end of the week with the stop loss price and decide whether each open position is to be closed or held the following week. I check the short term trades in the newsletter using daily charts to review whether my profit taker /targets or Initial Stop/Trailing Stops have been triggered. The Short term notional portfolio and strategies described in Question 12 rely on end of day data which, while taking longer to administer than managing weekly charts, still frees up our time during the day to work a conventional job or business or to partake in activities of our choosing. Hence, this monitoring and review activity should only take even a novice investor about thirty minutes a day and less once experienced. 6.5 What are Your Daily Investing Goals? Finally, put away the magnifying glass and get out the microscope. On a day-to-day basis, what are you trying to achieve? How will you measure your progress and how will your hard work be rewarded? Disclaimer: Direct investing in the stock market can result in financial loss. Historical results are no guarantee of future returns. No representation is being made that any account will or is likely to achieve profits or losses similar to those shown. Stock tips or ‘buy’ or sell recommendations are not provided. This educational information is not designed to replace your Licensed Financial Consultant or your Stockbroker. It has been prepared without regard to any particular person's investment objectives, financial situation and particular needs. This information is of a general nature only so you should seek advice from your broker or other investment advisors as appropriate before taking any action. The decision to trade and the method of trading is for the reader alone to decide. Avestra Securities Pty Ltd (Avestra) AFSL 292464, and ShareTradingEducation.com (“STE”), as Corporate Authorized Representative of Avestra, disclaims all liability of Avestra, STE and its Associates for any loss or damage suffered by any person by reason of the use by that person of, or their reliance on any information contained herein, whether arising from the negligence of Avestra, STE or its Associates or otherwise. Refer also to the full disclaimer at the back of each newsletter Edition and our Terms of Use. How to Write Your Own Stock & Futures Trading Plan Copyright© 2008 Tim Wilcox, Jim Berg, John Atkinson & Sharetradingeducation.com 29 TW: My daily trading goal is to . . . (trade according to my plan. Today I will stick to my plan because it is detailed, specific, tested and profitable. I am confident that I have the self discipline to adhere to it which, in turn, will ensure that my weekly, monthly and annual goals are met). Assuming that I stick to my plan, I will pat myself on the back by . . . (having a little ‘night cap’ at bedtime. Nothing blended - single malt, obviously!) JB: As noted above, our primary aim of our notional newsletter Portfolio is to find and manage low volatility, fundamentally and technically sound shares in rising up trends. We will also include some shares selected by ‘professional’ analysts if they also match my entry criteria. My weekly goal is to remain disciplined and not to look at how daily market ‘noise’ may affect the shares in my Long Term Investing Portfolio, as I manage it using weekly charts . For our notional short term trading portfolio we will monitor end of day data and determine if any stops have been triggered or profit targets met and list any actions for the next day. Our daily goals will include checking our: Charts to see if any shares on our ‘qualified’ watch lists have shown an entry signal Emails to see if our broker has identified a new potential Share Purchase Plan (SPP) which fits our Trading Plan Rules. If so, we will check: If adding an extra position will comply with our total portfolio money management rules in Chapter 4 The closing date of any entitlement (for SPP’s) If we have funds available in our notional portfolio to open the position or make the initial SPP entitlement purchase If and only if all ‘planets are aligned’ to allow us to trade with ‘weight-of-evidence’ according to our Trading Plan, then we will take action to enter If any stocks/shares have generated an exit signal by our exit rules, we will also take action and ‘sell’ the following day. (Refer 11.8 and 11.9) It is vitally important to develop a mechanized system of trading and investing. Our aim is to operate in a structured and disciplined manner, without allowing interference of any subjectivity and emotion. This is developed through paper trading initially and then by repeated practice with real funds in a systematic process. (Refer also 9.3 below). Disclaimer: Direct investing in the stock market can result in financial loss. Historical results are no guarantee of future returns. No representation is being made that any account will or is likely to achieve profits or losses similar to those shown. Stock tips or ‘buy’ or sell recommendations are not provided. This educational information is not designed to replace your Licensed Financial Consultant or your Stockbroker. It has been prepared without regard to any particular person's investment objectives, financial situation and particular needs. This information is of a general nature only so you should seek advice from your broker or other investment advisors as appropriate before taking any action. The decision to trade and the method of trading is for the reader alone to decide. Avestra Securities Pty Ltd (Avestra) AFSL 292464, and ShareTradingEducation.com (“STE”), as Corporate Authorized Representative of Avestra, disclaims all liability of Avestra, STE and its Associates for any loss or damage suffered by any person by reason of the use by that person of, or their reliance on any information contained herein, whether arising from the negligence of Avestra, STE or its Associates or otherwise. Refer also to the full disclaimer at the back of each newsletter Edition and our Terms of Use. How to Write Your Own Stock & Futures Trading Plan Copyright© 2008 Tim Wilcox, Jim Berg, John Atkinson & Sharetradingeducation.com 30 CHAPTER 3 MARKETS & TOOLS of the TRADE By Tim Wilcox, Jim Berg & John Atkinson • Markets, Instruments & Timeframes • Tools of the Trade • Before The Market Opens Disclaimer: Direct investing in the stock market can result in financial loss. Historical results are no guarantee of future returns. No representation is being made that any account will or is likely to achieve profits or losses similar to those shown. Stock tips or ‘buy’ or sell recommendations are not provided. This educational information is not designed to replace your Licensed Financial Consultant or your Stockbroker. It has been prepared without regard to any particular person's investment objectives, financial situation and particular needs. This information is of a general nature only so you should seek advice from your broker or other investment advisors as appropriate before taking any action. The decision to trade and the method of trading is for the reader alone to decide. Avestra Securities Pty Ltd (Avestra) AFSL 292464, and ShareTradingEducation.com (“STE”), as Corporate Authorized Representative of Avestra, disclaims all liability of Avestra, STE and its Associates for any loss or damage suffered by any person by reason of the use by that person of, or their reliance on any information contained herein, whether arising from the negligence of Avestra, STE or its Associates or otherwise. Refer also to the full disclaimer at the back of each newsletter Edition and our Terms of Use. How to Write Your Own Stock & Futures Trading Plan Copyright© 2008 Tim Wilcox, Jim Berg, John Atkinson & Sharetradingeducation.com CHAPTER 3. 31 MARKETS & TOOLS of the TRADE 7. Markets, Instruments & Timeframes 7.1 Which Markets will you Trade or Invest? Decide upon the market you wish to invest and trade in; the instrument(s) that are available within that market and the reasons for your choice. As a general rule of thumb, professional investors and traders tend to restrict their focus to a limited number of markets and instruments. By contrast, novice traders tend to trade index futures one day, currency pairs the next and exotic sounding commodities like pork bellies the day after that, etc! TW: The instruments that I will trade are . . . (U.S. stocks in the evening after work because good opportunities exist in the 7-9pm session. They also provide excellent liquidity, volatility, tight spreads, fast fills, low commissions and no stamp duty). JB: My answers here again are twofold – those for my own personal trading activity and those for the Trading Plan for our newsletter. They are very closely aligned except that I sometimes also employ short term leveraged trading to complement the medium to longer term trend trading ‘buy and hold’ strategy for my own Long term Investing Portfolio. The overall basis of my strategies is to select shares which: Are temporarily oversold in a rising uptrend and Have given an entry signal using my documented rules. If ‘funds’ are available, the aim is to include them in the portfolio for hopefully weeks, months or perhaps years, demonstrating to our readers that they do not have to be glued to a screen all day to be successful in the market. The precise duration will be determined by: Whether the choice has been at the outset to manage the share with daily charts, tighter stops and short term profit taking or with weekly charts and lower stop losses, to ‘let profits run’. The price action of the share when it eventually provides an exit signal. I use the tools I have learned or developed myself over more than 25 years of investing and trading - and which I teach in my weekend Boot Camp seminars, my ‘Trading Strategies with JB Charts’ and ‘Trading Strategies with Metastock’ Home Study courses and through our newsletter. Disclaimer: Direct investing in the stock market can result in financial loss. Historical results are no guarantee of future returns. No representation is being made that any account will or is likely to achieve profits or losses similar to those shown. Stock tips or ‘buy’ or sell recommendations are not provided. This educational information is not designed to replace your Licensed Financial Consultant or your Stockbroker. It has been prepared without regard to any particular person's investment objectives, financial situation and particular needs. This information is of a general nature only so you should seek advice from your broker or other investment advisors as appropriate before taking any action. The decision to trade and the method of trading is for the reader alone to decide. Avestra Securities Pty Ltd (Avestra) AFSL 292464, and ShareTradingEducation.com (“STE”), as Corporate Authorized Representative of Avestra, disclaims all liability of Avestra, STE and its Associates for any loss or damage suffered by any person by reason of the use by that person of, or their reliance on any information contained herein, whether arising from the negligence of Avestra, STE or its Associates or otherwise. Refer also to the full disclaimer at the back of each newsletter Edition and our Terms of Use. How to Write Your Own Stock & Futures Trading Plan Copyright© 2008 Tim Wilcox, Jim Berg, John Atkinson & Sharetradingeducation.com 32 The market that I predominantly trade and the one we will use for our newsletter notional portfolio is the Australian share market. However, in time, we also plan to feature stocks from other markets (e.g. USA) to demonstrate that the principles are not market specific and may be used in many other markets around the world. If a stock is fundamentally sound and has positive market sentiment behind it, then the market dynamics should be similar - irrespective of where the market is located. The beauty of learning fundamental & technical analysis; money and risk management; personal and market psychology is that once you have learned and practiced the principles, then it usually doesn’t matter which market you look at – the broad principles remain the same. 7.2 Which Instruments Will You Trade or Invest? Will you confine yourself to a basket of stocks or will you invest or trade anything and everything on the XYZ exchange? If you trade futures, how many different markets will you trade, and why? If you are a forex trader, how many currency pairs will you trade, and why? TW: The quantity of stocks / futures contracts / currency pairs that I will trade will . . . (not exceed X and be determined according to their liquidity, i.e. a minimum daily volume of 2 million shares, and according to their volatility, i.e. an average minimum daily range of $1.50). JB: I prefer to focus my personal investing in shares of low risk companies, those which are monopolies /near monopolies and are all in a rising trend and sector. We will largely mirror this approach in the newsletter notional portfolio for most of our selections. To ensure we can easily enter or exit the market and to avoid being ‘whip-sawed’ in and out of positions unnecessarily, we will concentrate mainly on those Australian shares which fit my fundamental and technical analysis criteria, provide sufficient liquidity and do not exhibit excessive volatility. 7.3 Which Timeframes will you Trade or Invest? Hopefully, you have decided what sort of investor or trader you are or want to become, i.e. an intraday, swing or longer term position investor. Now you need to focus in on your timeframes within the category of your choice. Be very clear in your own mind about the number of timeframes you use and why you use them. For example, a day trader may use a 1 minute timeframe to enter a trade, a 5 minute timeframe to exit a trade and a 15 minute timeframe to help determine the trend throughout the duration of the trade. TW: As a swing trader, I will use . . . (daily charts to determine the trend; 10 minute charts to enter and exit positions and 60 minute charts to monitor my open positions). Disclaimer: Direct investing in the stock market can result in financial loss. Historical results are no guarantee of future returns. No representation is being made that any account will or is likely to achieve profits or losses similar to those shown. Stock tips or ‘buy’ or sell recommendations are not provided. This educational information is not designed to replace your Licensed Financial Consultant or your Stockbroker. It has been prepared without regard to any particular person's investment objectives, financial situation and particular needs. This information is of a general nature only so you should seek advice from your broker or other investment advisors as appropriate before taking any action. The decision to trade and the method of trading is for the reader alone to decide. Avestra Securities Pty Ltd (Avestra) AFSL 292464, and ShareTradingEducation.com (“STE”), as Corporate Authorized Representative of Avestra, disclaims all liability of Avestra, STE and its Associates for any loss or damage suffered by any person by reason of the use by that person of, or their reliance on any information contained herein, whether arising from the negligence of Avestra, STE or its Associates or otherwise. Refer also to the full disclaimer at the back of each newsletter Edition and our Terms of Use. How to Write Your Own Stock & Futures Trading Plan Copyright© 2008 Tim Wilcox, Jim Berg, John Atkinson & Sharetradingeducation.com 33 JB: For both my own investing and for our newsletter notional portfolio, my analysis starts with weekly charts to determine the major trend. I then target RSI (7) Oversold ‘Alert’ conditions within that rising market, as explained further in Question 12. By the time I get down to the ‘buy’ decision, for my own personal trading and the newsletter portfolio, I use daily charts to time my entry. We emphasize that before a stock/share is added to our notional Portfolios, there are many hurdles that the potential candidate must get over. To be selected it should: Match our Fundamental AND Technical Analysis rules AND Satisfy our money management rules including: Individual trade risk o Sector risk and o Total portfolio risk AND Have given a ‘buy signal’ Then and only then will we take this as suitable weight-of-evidence to take action. 8. Tools of the Trade 8.1 Which Financial Vehicle will you Use to Trade or Invest? Whichever vehicle you use to trade; Shares, Spread Betting, Contracts for Difference (CFDs.) etc. understand fully the pros and cons associated with your choice. This applies to Spread Betting especially. Without question, it is a very popular financial product that is ideal for novice traders, but it does have its drawbacks. For example, it is almost impossible to day trade profitably using this trading vehicle. TW: My choice of financial vehicle is . . . (Spread Betting because I can open an account with just £100, trade just 1p per point and profits are currently tax free in UK. However, I understand the limitations of this product and that it is best suited to swing trading). JB: There are hundreds of ways of trading the market. My own personal choice of financial vehicle is to use ordinary shares for both long term investing and short term trading. My business partner John Atkinson also sometimes trades pattern trades with lower priced shares for leverage for his short term trading. Disclaimer: Direct investing in the stock market can result in financial loss. Historical results are no guarantee of future returns. No representation is being made that any account will or is likely to achieve profits or losses similar to those shown. Stock tips or ‘buy’ or sell recommendations are not provided. This educational information is not designed to replace your Licensed Financial Consultant or your Stockbroker. It has been prepared without regard to any particular person's investment objectives, financial situation and particular needs. This information is of a general nature only so you should seek advice from your broker or other investment advisors as appropriate before taking any action. The decision to trade and the method of trading is for the reader alone to decide. Avestra Securities Pty Ltd (Avestra) AFSL 292464, and ShareTradingEducation.com (“STE”), as Corporate Authorized Representative of Avestra, disclaims all liability of Avestra, STE and its Associates for any loss or damage suffered by any person by reason of the use by that person of, or their reliance on any information contained herein, whether arising from the negligence of Avestra, STE or its Associates or otherwise. Refer also to the full disclaimer at the back of each newsletter Edition and our Terms of Use. How to Write Your Own Stock & Futures Trading Plan Copyright© 2008 Tim Wilcox, Jim Berg, John Atkinson & Sharetradingeducation.com 34 Full details on my Short term trading strategy are provided in Question 12. Sometimes I also use CFDs for short term trading. Due to their leverage, CFDs have the effect of luring unprepared novices with the potential of increased profits on to the ‘fast track’. While this may eventuate for some experienced traders, what is not realized until it is often too late is that leveraged instruments work both ways. So losses have the potential to also be magnified and at a much faster rate. We include this warning as our goal in our ebooks and newsletter is to warn our readers of the market pitfalls as well as providing education on successful strategies. We have seen too many ‘wannabe’ traders have their portfolios cavitate very quickly. One internationally renowned trader said “Trading CFDs is like driving home at full speed through all the red lights – and hoping to get home safely”. The need for strict money & risk management coupled with very good personal psychology and analysis skills becomes even more paramount when trading leveraged instruments. They are the domain of very experienced traders only. So, for our newsletter portfolios we will concentrate only on investing and trading in equities as many of our readers may be new to the market or may not have yet learned how to consistently make profits investing in stocks/shares. By finding low volatility up trending shares which are fundamentally sound and have been ‘bought’ in the correct ‘buy zone’ according to my Trading Plan rules, we increase our probability of success. However, we still know that not every shares trade will be profitable. Some will be unprofitable but as long as we are disciplined and cut our losses quickly, then we will progress overall. 8.2 Which Broker and Trading Platform Will You Use to Trade or Invest? Your broker and trading platform are critical to your performance, just as Roger Federer’s tennis racket or Johnny Wilkinson’s rugby boots are critical to theirs. Both players would perform well with any old kit, but choosing these primary tools with great care helps them to achieve consistent sporting excellence. As a starting point, the choice of broker is likely to be determined by the following six things: 1. The instruments that you wish to trade. If, for example, you wish to trade U.S. stocks, which broker offers the largest universe of shares and how do their spreads / commissions compare with their competitors? 2. The vehicle (or financial product) you use to trade the instruments of your choice. Spread betting, CFDs, options, futures, forex or direct access? 3. The size of your account. If you have only limited capital with which to fund your trading, you are not going to be able to open a Patten Day trader (P.D.T.) account with a direct access broker. Furthermore, the choice of brokers offering CFDs is likely to be limited. Spread Betting may be your only viable option and is where many new traders start Disclaimer: Direct investing in the stock market can result in financial loss. Historical results are no guarantee of future returns. No representation is being made that any account will or is likely to achieve profits or losses similar to those shown. Stock tips or ‘buy’ or sell recommendations are not provided. This educational information is not designed to replace your Licensed Financial Consultant or your Stockbroker. It has been prepared without regard to any particular person's investment objectives, financial situation and particular needs. This information is of a general nature only so you should seek advice from your broker or other investment advisors as appropriate before taking any action. The decision to trade and the method of trading is for the reader alone to decide. Avestra Securities Pty Ltd (Avestra) AFSL 292464, and ShareTradingEducation.com (“STE”), as Corporate Authorized Representative of Avestra, disclaims all liability of Avestra, STE and its Associates for any loss or damage suffered by any person by reason of the use by that person of, or their reliance on any information contained herein, whether arising from the negligence of Avestra, STE or its Associates or otherwise. Refer also to the full disclaimer at the back of each newsletter Edition and our Terms of Use. 35 How to Write Your Own Stock & Futures Trading Plan Copyright© 2008 Tim Wilcox, Jim Berg, John Atkinson & Sharetradingeducation.com (JB: This may be so in UK but in Australia most authors suggest traders become confident & profitable in investing and trading shares for a few years before venturing into leveraged instruments). 4. The platform you use to trade. This is usually the one supplied by the broker. It must offer the features that you require and you must be comfortable using it. 5. The level of support and customer service offered by the broker. Check out the reviews on T2W to see how the broker you propose to use fairs. (Editor: UK site) 6. Your level of experience. Many professionals advise the novice trader against opening an account with a futures broker and, say, starting to trade the e-mini S&P. Choose instrument(s) and a broker that you can cut your teeth on and minimise the risk of losing your shirt! TW: My choice of broker is . . .(Fleece’Em.com because they offer the universe of stocks that I require with competitive spreads; they have won numerous industry awards for their lightning fast trading platform and their customer service is second to none). JB We acknowledge that readers of this ebook and our newsletter will have their own preferences for the broker which they choose to use. Figure 3.1 Ronin Asset Management We are a Corporate Authorised Representative of Avestra Capital Pty Ltd. Ronin Asset Management is also a Corporate Authorised Representative of Avestra. Based in Sydney, Ronin Asset Management provides global advice & execution through state of the art trading systems. They offer advice on Australian and International Equities, Options, Futures, Exchange Traded Fund’s (ETFs), Contracts for Difference (CFDs), Margin Foreign Exchange and Investment Property purchases. Nicholas Cooke, Head of Operations at Ronin Asset Management says: " In life you get what you pay for. Don't leave your financial future to chance. We're here to help advise you along the way. At Ronin we believe that to achieve the most out of life people need to have dreams and passions. Our purpose as an organisation is to support our clients in defining and achieving their financial goals. At Ronin we understand the importance of income and asset creation and we equally understand the importance of risk protection. Our expert general financial advice and specialist knowledge allow our private advisory clients and high net worth individuals to navigate the Global Financial Markets in all conditions. We have strong, lasting relationships with our clients, providing our financial expertise and advice to deliver a superior offering and customer experience." You may contact Nicholas Cooke at Ronin Asset Management by: Email: nick.cooke@roninassetmanagement.com or Phone (Australia): 1300 334 626 Disclaimer: Direct investing in the stock market can result in financial loss. Historical results are no guarantee of future returns. No representation is being made that any account will or is likely to achieve profits or losses similar to those shown. Stock tips or ‘buy’ or sell recommendations are not provided. This educational information is not designed to replace your Licensed Financial Consultant or your Stockbroker. It has been prepared without regard to any particular person's investment objectives, financial situation and particular needs. This information is of a general nature only so you should seek advice from your broker or other investment advisors as appropriate before taking any action. The decision to trade and the method of trading is for the reader alone to decide. Avestra Securities Pty Ltd (Avestra) AFSL 292464, and ShareTradingEducation.com (“STE”), as Corporate Authorized Representative of Avestra, disclaims all liability of Avestra, STE and its Associates for any loss or damage suffered by any person by reason of the use by that person of, or their reliance on any information contained herein, whether arising from the negligence of Avestra, STE or its Associates or otherwise. Refer also to the full disclaimer at the back of each newsletter Edition and our Terms of Use. 36 How to Write Your Own Stock & Futures Trading Plan Copyright© 2008 Tim Wilcox, Jim Berg, John Atkinson & Sharetradingeducation.com 8.3 Which Software & Data Feeds will you Use to Trade or Invest? If your trading decisions are based upon technical analysis (T.A.), make sure your data provider and charting platform has the features you want but is not charging you for fancy gizmos that you do not need and will not use. TW: My choice of data feed is . . . (SlowQuote.com because they provide data for the instruments I want to trade, whilst providing the option to upgrade, giving me access to other exchanges with real time data in the event that my trading style and strategies change). JB: Again we acknowledge that readers of this ebook and our newsletter will have their own preferences for the software and data feeds which they choose to use. Personally, we use our JB Premium Charting /JB Data Indicators built into the program for user friendly charting. package which has my JB Volatility (Metastock users can add my JB Volatility Template to view my indicators on their screen) Figure 3.2 Scanvest Figure 3.3 MarketScan Scanvest (Figure 3.2) is a useful tool for back testing trading systems on historical data - before traders and investors commit real funds. Disclaimer: Direct investing in the stock market can result in financial loss. Historical results are no guarantee of future returns. No representation is being made that any account will or is likely to achieve profits or losses similar to those shown. Stock tips or ‘buy’ or sell recommendations are not provided. This educational information is not designed to replace your Licensed Financial Consultant or your Stockbroker. It has been prepared without regard to any particular person's investment objectives, financial situation and particular needs. This information is of a general nature only so you should seek advice from your broker or other investment advisors as appropriate before taking any action. The decision to trade and the method of trading is for the reader alone to decide. Avestra Securities Pty Ltd (Avestra) AFSL 292464, and ShareTradingEducation.com (“STE”), as Corporate Authorized Representative of Avestra, disclaims all liability of Avestra, STE and its Associates for any loss or damage suffered by any person by reason of the use by that person of, or their reliance on any information contained herein, whether arising from the negligence of Avestra, STE or its Associates or otherwise. Refer also to the full disclaimer at the back of each newsletter Edition and our Terms of Use. How to Write Your Own Stock & Futures Trading Plan Copyright© 2008 Tim Wilcox, Jim Berg, John Atkinson & Sharetradingeducation.com 37 I also use MarketScan (Figure 3.3) to simply and easily filter stocks based on my fundamental analysis criteria. Both these scanning programs are discussed further in my ebook ‘The Stock Trading Handbook – Fundamental & Technical Analysis Combined’. Pro Trader and Bullcharts are also available at our site, with more detailed descriptions presented there, including a zip file on the latter in our Free Downloads Section. Both these programs feature easy to use and powerful explorations. Bullcharts includes indicators designed by many high profile trader-authors. Protrader includes a useful search which reveals all stocks which have broken through resistance lines drawn previously by the user. 9. Before the Market Opens . . . 9.1 To begin trading without doing your homework beforehand is a bit like embarking on that car journey from John O’Groats to Land’s End mentioned earlier without checking the oil and fuel levels before setting off. It is essential to undergo a daily pre-market routine to ensure that you are prepared fully for the trading day ahead. 9.2 What is Your Daily Pre-market Routine? As the question implies, these are the things you do every day to ensure that when the time comes to ‘pull the trigger’, the probable outcome is in your favour. TW: My daily pre-market routine comprises five key areas, namely: 1. To analyse and log yesterday’s trades. 2. To review any open positions and update targets and stops. 3. To assess today’s market conditions and plan accordingly. 4. To plan the day ahead, hour by hour. 5. To make an initial selection of possible instruments to trade. JB: Refer 9.3 below 9.3 Have You Analysed Yesterday’s Trades? Have you completed your analysis of yesterday’s trades, logged them and updated your journal? Did you adhere to your plan and, if not, what effect does this have on your trading activity today? In other words, your ability (or otherwise) to stick to your trading plan yesterday, should determine your trading activity today. TW: Each day, I will ensure that yesterday’s trades are . . . (analysed and logged and that my trading journal is up to date. Additionally, I will check to ensure that I adhered to all aspects of my trading plan). Disclaimer: Direct investing in the stock market can result in financial loss. Historical results are no guarantee of future returns. No representation is being made that any account will or is likely to achieve profits or losses similar to those shown. Stock tips or ‘buy’ or sell recommendations are not provided. This educational information is not designed to replace your Licensed Financial Consultant or your Stockbroker. It has been prepared without regard to any particular person's investment objectives, financial situation and particular needs. This information is of a general nature only so you should seek advice from your broker or other investment advisors as appropriate before taking any action. The decision to trade and the method of trading is for the reader alone to decide. Avestra Securities Pty Ltd (Avestra) AFSL 292464, and ShareTradingEducation.com (“STE”), as Corporate Authorized Representative of Avestra, disclaims all liability of Avestra, STE and its Associates for any loss or damage suffered by any person by reason of the use by that person of, or their reliance on any information contained herein, whether arising from the negligence of Avestra, STE or its Associates or otherwise. Refer also to the full disclaimer at the back of each newsletter Edition and our Terms of Use. How to Write Your Own Stock & Futures Trading Plan Copyright© 2008 Tim Wilcox, Jim Berg, John Atkinson & Sharetradingeducation.com 38 In the event that I fail to adhere to my trading plan . . . (I will amend the new day’s trading activity in accordance with the discipline procedures detailed in section 14.3 of my plan). JB: For my own personal trading, most of my analysis is done after the market closes and takes only a few minutes. I update my database, analyze any new positions entered or closed that day and log them into my trading journal. If trading funds are available, I scroll through my watch lists to find new entry signals that would need to be acted upon the following morning. The primary aim of our newsletter portfolios is to function as paper trading exercises. This shows our readers how they can adapt my proven systems for long term investing and short term trading strategies for their own style and personalities. For my long term notional portfolio I: 1. Select just a handful of fundamentally strong shares which are trending higher without excessive volatility 2. Calculate the applicable Money and Risk Management factors (refer Chapter 4) to optimize individual trade risk, sector risk and combined portfolio risk 3. Manage this portfolio on a once a week basis without the need to be a ‘screen jockey’ glued to a trading screen. 4. Sell the losing positions at a minimal loss to ‘cut losses short’ if my Initial Stops are triggered (refer 11.8) 5. Hold on to the winning positions to ‘let your profits run’ and only sell them when an exit signal is generated (refer 11.9). 6. By carrying out items 1 to 5 in a systematic structured fashion, I have created a successful and disciplined weekly pattern, without letting emotions affect the decision making process. This takes me about 15 minutes a week, once I’m fully invested. Consequently, for this portfolio there is no need to carry out daily activities associated with the market. As predominantly an ‘investor’ rather than a ‘trades’ I recognise that this strategy means I may miss some short term profit taking opportunities. However, I also know that this reduces stress levels, emotional decisions and demanding workload from ‘screen watching’. It also allows me to stay with longer term trend trades for the long haul, without being ‘whipsawed’ in and out. From time to time, we review the performance of a notional long term investing portfolio in the newsletter – compiled from stocks selected from our short term portfolio. The aim is to demonstrate to our readers that they too can ‘get on with life’ and still thrive in the market overall. Disclaimer: Direct investing in the stock market can result in financial loss. Historical results are no guarantee of future returns. No representation is being made that any account will or is likely to achieve profits or losses similar to those shown. Stock tips or ‘buy’ or sell recommendations are not provided. This educational information is not designed to replace your Licensed Financial Consultant or your Stockbroker. It has been prepared without regard to any particular person's investment objectives, financial situation and particular needs. This information is of a general nature only so you should seek advice from your broker or other investment advisors as appropriate before taking any action. The decision to trade and the method of trading is for the reader alone to decide. Avestra Securities Pty Ltd (Avestra) AFSL 292464, and ShareTradingEducation.com (“STE”), as Corporate Authorized Representative of Avestra, disclaims all liability of Avestra, STE and its Associates for any loss or damage suffered by any person by reason of the use by that person of, or their reliance on any information contained herein, whether arising from the negligence of Avestra, STE or its Associates or otherwise. Refer also to the full disclaimer at the back of each newsletter Edition and our Terms of Use. How to Write Your Own Stock & Futures Trading Plan Copyright© 2008 Tim Wilcox, Jim Berg, John Atkinson & Sharetradingeducation.com 39 For those preferring to trade in shorter time frames of a few days to a few weeks, our Short Term Trading portfolio provides additional education on this subject (refer Question 12.6). Again, we carry out a similar system of the six steps shown above, though using an end-of-day timeframe and with tighter stop losses. For our notional portfolio in the newsletter we: 9 Review open positions (see 9.4) at the close of the week. 9 Update our records of each notional trade once a week and post them in that week’s newsletter 9 Examine potential notional trades from our watch lists on the weekend prior to the following week’s Edition of our newsletter. 9 If a stock/share is selected which also matches all my ‘buy’ criteria and if funds are available, a notional entry may be taken on the day after a blue bar entry signal is generated during the week (refer Question 12), provided that this is no higher than the high of the day of the entry trigger 9 If a stock/share has triggered an exit condition, the trade will be exited with discipline and the trade records updated accordingly. While the stock selection process may vary, it is of note that my blue bar entry volatility based signal and Initial Stop Loss are the same for both our notional long term investing and for our short term trading portfolios. The main difference in strategy from then on mainly relates to the exits – the level of the trailing stop loss position and whether or not we take profits using the Berg Profit taker (refer Questions 11 and 12). 9.4 Have You Any Positions Open? If it is not clearly laid out in your plan to hold positions overnight, don’t! However, if you are a swing or position trader, you may well have some open positions. TW: If I have positions open in the market . . . (I will update targets and stop losses and confirm that the reasons for entering the trade in the first place are still valid). JB: I am a trend trader which means I keep positions overnight and hold them for as long as possible, according to my rules. All open positions are analyzed for exit signals. My personal stops for my own trading and investing are end-of-day or end-of-week respectively, so action needs to be taken the following day, or on Monday for weekly charts. Disclaimer: Direct investing in the stock market can result in financial loss. Historical results are no guarantee of future returns. No representation is being made that any account will or is likely to achieve profits or losses similar to those shown. Stock tips or ‘buy’ or sell recommendations are not provided. This educational information is not designed to replace your Licensed Financial Consultant or your Stockbroker. It has been prepared without regard to any particular person's investment objectives, financial situation and particular needs. This information is of a general nature only so you should seek advice from your broker or other investment advisors as appropriate before taking any action. The decision to trade and the method of trading is for the reader alone to decide. Avestra Securities Pty Ltd (Avestra) AFSL 292464, and ShareTradingEducation.com (“STE”), as Corporate Authorized Representative of Avestra, disclaims all liability of Avestra, STE and its Associates for any loss or damage suffered by any person by reason of the use by that person of, or their reliance on any information contained herein, whether arising from the negligence of Avestra, STE or its Associates or otherwise. Refer also to the full disclaimer at the back of each newsletter Edition and our Terms of Use. How to Write Your Own Stock & Futures Trading Plan Copyright© 2008 Tim Wilcox, Jim Berg, John Atkinson & Sharetradingeducation.com 40 For my personal long term conservative stock investing I am prepared to wait for one week of closes below my Initial Stop Loss and two consecutive weeks of closes below my Trailing Stop Loss before taking action (refer 11.8 and 11.9). For shorter term trading I exit once prices close after one day’s close below my Initial Stop and two consecutive days, below the trailing stop i.e. not weeks. I have discovered, from much back-analysis, that by giving stocks/shares this amount of extra room, they may become oversold and bounce back from this level to resume their up trends. If not, I exit without ‘arguing’ with myself and the market. Not all traders, particularly novices, may have the same discipline. They may think “I can’t sell it now it’s so far down” if prices continue to fall. In acknowledging this, when setting our stops for the long term investing notional portfolio we also report from time to time on the action of using the equivalent of the Conditional Order Stop Loss Orders facility (Refer 8.2). For those traders or investors who choose to use conditional stop loss ordering, then if at any time during the week the stock price action falls and trades below their nominated stop loss level, then the notional trade may be ‘closed’ automatically at a price as close as possible to their predetermined stop loss level. This allows them to carry on their day to day activities, confidently knowing that if their exit conditions are triggered, then their Conditional Stop Loss Order(s) will be executed by a third party. These traders look upon it as a type of insurance. The main advantages in setting their stops this way are that: 9 Actually exiting after a stop has been hit is one of the most difficult actions to do for most investors and traders. They look for excuses to stay with the trade, in the hope that it “will go back up”. However, unfortunately it only takes one large loss to offset many small profits –- and most large losses usually start out as small losses that have been allowed to run uncontrolled! Do that several times and one’s portfolio looks sick very quickly. 9 Having a Conditional Ordering facility to execute the stops on their behalf removes the ability for them to look for excuses. It helps protect them from themselves - and therefore the potential risk of much greater losses. 9 There is an old stock market cliché that “the bulls go up the stairs but the bears go out the window.” This means that prices may climb a few percent over several weeks but any such gains can be totally eliminated in days, or sometimes within minutes. 9 Using conditional stop loss orders means that they exit at or close to their nominated price level. If prices continue to fall, they do not have to wait until the end of the day or even up to 2 weeks later before taking action. Correspondingly, if the uptrend continues, then they can also observe from the sidelines and decide whether to rejoin at a slightly higher price, provided their entry conditions are met. However they need to remain aware of the potential pitfall of being ‘whipsawed’ in and out. Disclaimer: Direct investing in the stock market can result in financial loss. Historical results are no guarantee of future returns. No representation is being made that any account will or is likely to achieve profits or losses similar to those shown. Stock tips or ‘buy’ or sell recommendations are not provided. This educational information is not designed to replace your Licensed Financial Consultant or your Stockbroker. It has been prepared without regard to any particular person's investment objectives, financial situation and particular needs. This information is of a general nature only so you should seek advice from your broker or other investment advisors as appropriate before taking any action. The decision to trade and the method of trading is for the reader alone to decide. Avestra Securities Pty Ltd (Avestra) AFSL 292464, and ShareTradingEducation.com (“STE”), as Corporate Authorized Representative of Avestra, disclaims all liability of Avestra, STE and its Associates for any loss or damage suffered by any person by reason of the use by that person of, or their reliance on any information contained herein, whether arising from the negligence of Avestra, STE or its Associates or otherwise. Refer also to the full disclaimer at the back of each newsletter Edition and our Terms of Use. How to Write Your Own Stock & Futures Trading Plan Copyright© 2008 Tim Wilcox, Jim Berg, John Atkinson & Sharetradingeducation.com 41 Through a few notional trade examples in the newsletter we showed that in a rising bullish market there have been occasions whereby the use of intraday conditional stops have resulted in premature closing of the trade - as some of these stocks have rebounded during the day and continued their rise. A trader using conditional stops at that time would have had two ways to look at this: i) The –ve viewpoint- disappointment of being ejected from the trade too early ii) The +ve viewpoint – pleased that his insurance policy was working and protecting him in case of a sudden downturn. For those who used intraday conditional stops in correction in recent years e.g. May 2006, August 2007 and January 2008, their insurance really kicked in as they would have got home from work (or the golf course etc.) and found that many of their conditional orders to sell if prices hit a certain value would have been triggered. Their trades would have been closed by their conditional stop loss facility. Those who waited for closes below stop loss levels during those months may have experienced a different level of emotion than their counterparts who use conditional stop loss orders and who had closed their trades much sooner. The real test then came for those who found their stocks trading well below their stops. For the conditional stop loss user, they did not have to go through this test as their trades had already been closed days earlier. There are advantages in both approaches. The main lesson here is that we each need to work out, as part of our own personal trading plan, whether we use: ⇒ Weekly charts and weekly stops or ⇒ Daily charts with closes 1 or 2 days below the stops or ⇒ Weekly or daily charts with intraday conditional stops Traders and investors who know they have a ‘freezing problem’ may make the decision to use intraday stops regardless. They know from personal experience that they would rather have someone else act on their behalf at predetermined levels than go through the anguish of not being able to pull the trigger themselves when they are put to the real test. For those who choose conditional stops, then they need to be aware that there is one significant risk other than the possibility of early closing of the trade. If there are very few buyers queued in the ‘bid stack’, then there is a real possibility that there could be an unnecessary and artificial cascading of prices, caused by electronic broker’s computers dumping stock in a domino effect. In the Australian market in which John and I trade, since late 2003 some prices have been seen to plummet literally 10 or 15% or more in hundredths of a second ……… and subsequently rebound often only minutes later as bargain hunters chase up prices. Disclaimer: Direct investing in the stock market can result in financial loss. Historical results are no guarantee of future returns. No representation is being made that any account will or is likely to achieve profits or losses similar to those shown. Stock tips or ‘buy’ or sell recommendations are not provided. This educational information is not designed to replace your Licensed Financial Consultant or your Stockbroker. It has been prepared without regard to any particular person's investment objectives, financial situation and particular needs. This information is of a general nature only so you should seek advice from your broker or other investment advisors as appropriate before taking any action. The decision to trade and the method of trading is for the reader alone to decide. Avestra Securities Pty Ltd (Avestra) AFSL 292464, and ShareTradingEducation.com (“STE”), as Corporate Authorized Representative of Avestra, disclaims all liability of Avestra, STE and its Associates for any loss or damage suffered by any person by reason of the use by that person of, or their reliance on any information contained herein, whether arising from the negligence of Avestra, STE or its Associates or otherwise. Refer also to the full disclaimer at the back of each newsletter Edition and our Terms of Use. How to Write Your Own Stock & Futures Trading Plan Copyright© 2008 Tim Wilcox, Jim Berg, John Atkinson & Sharetradingeducation.com 42 John Atkinson wrote at length about various Exit Strategies and included conditional exits in his original work for Daryl Guppy’s newsletter ‘Tutorials in Applied Technical Analysis (www.guppytraders.com). These are now re-republished in his ‘Atkinson-Guppy Articles’ ebook. John called this computerized cascading phenomenon “avalanche selling”. An extract is shown in Figure 3.4 below. He showed that he found a major advantage in using a ‘hybrid’ service - so that humans actually place the sell order once the audible automated conditional stop trigger alarm goes off. Their experienced staff can monitor the screen and see if automated avalanche selling is occurring or not - then decide whether or not to place a sell order on your behalf, depending on your instructions. When such avalanche selling occurs, it can often be recognized later from end of day charts, due to the strong rebound from an out-of-context extremely low price for the day. Those traders who have access to the ‘Course of Sales’ of all trades placed for the day may confirm this phenomenon. Figure 3.4 Avalanche Selling - CTX For example, Figure 3.4 shows extreme volatility in stock CTX on Thursday 11 December 2003 . In one day nearly three months of price increase were wiped out in minutes as it dropped 18% from a high of $4.58 to a low of $3.75. It then rebounded just as strongly by 15% to close at $4.32 the same day. This is a kangaroo tail pattern. For those wishing to read more details on the subject of conditional ordering, Max Lewis’ ebook ‘Conditional Order Trading Strategies’ (COTS) is available at www.Sharetradingeducation.com. For educational purposes, in our newsletter we will sometimes compare the outcome of exiting using conditional orders and my preferred method. Disclaimer: Direct investing in the stock market can result in financial loss. Historical results are no guarantee of future returns. No representation is being made that any account will or is likely to achieve profits or losses similar to those shown. Stock tips or ‘buy’ or sell recommendations are not provided. This educational information is not designed to replace your Licensed Financial Consultant or your Stockbroker. It has been prepared without regard to any particular person's investment objectives, financial situation and particular needs. This information is of a general nature only so you should seek advice from your broker or other investment advisors as appropriate before taking any action. The decision to trade and the method of trading is for the reader alone to decide. Avestra Securities Pty Ltd (Avestra) AFSL 292464, and ShareTradingEducation.com (“STE”), as Corporate Authorized Representative of Avestra, disclaims all liability of Avestra, STE and its Associates for any loss or damage suffered by any person by reason of the use by that person of, or their reliance on any information contained herein, whether arising from the negligence of Avestra, STE or its Associates or otherwise. Refer also to the full disclaimer at the back of each newsletter Edition and our Terms of Use. How to Write Your Own Stock & Futures Trading Plan Copyright© 2008 Tim Wilcox, Jim Berg, John Atkinson & Sharetradingeducation.com 43 As mentioned above, for my own personal trading I prefer to wait for close(s) below the stop loss as experience has shown that I can confidently exit with discipline if my exit conditions occur. 9.5 What are the General Market Conditions? Are there any major news stories impacting the markets? What are the index futures doing? Are there any key economic reports due out and at what time etc.? TW:Before trading, I will check . . . (1. index futures to see if they are flat, trending up/down or mixed. This is a positive/negative sign because . . . 2. to see if any key economic reports are due to be released and at what time – i.e. Michigan Sentiment. 3. to see if any key personnel are due to make announcements / speeches and at what time – i.e. company C.E.Os. or Alan Greenspan addressing Congress etc). I aim to trade the market reaction to these reports and speeches. Therefore, I will not trade for . . . (the first 15 minutes following the speech / announcement and observe the reaction to it by the market. This will help to ensure that I ‘trade what I see and not what I think’). JB: I take note of major news events and key economic reports, released during the previous 24 hours that could affect my trading. Before the local markets open, I check the U.S. markets to determine the extent of their moves and which sectors could affect our markets and my open positions through the day. For our longer term notional investment portfolio, we need to examine the bigger picture. Accordingly we will look at weekly charts and the major trend in order to check that there are higher highs and higher lows; prices are closing above the moving averages and that the moving averages are rising. Some investors choose not to ‘buy’ on Monday if the Dow Jones Index has fallen more than 100 points on the previous Friday in the USA. Some investors also consider the following rule, as applied by Alan Hull in his Active Investing Strategy, such that they will open new positions ONLY if the 10 and 30 day moving averages on both charts (the All Ords and the S&P 500) are NOT crossed to the down side. “These act as a traffic light, if they are both crossed to the down side, we STOP and go no further it is not a week to open any new long positions.” (www.alanhull.com). The purpose of this rule is to protect investors from ‘buying’ in a falling market and from trying to swim against the tide. This rule is not part of my own investing strategy. I use a comparison between the All Ordinaries Index and the S&P500 Index, monitoring whether they are in a rising or falling trend on a weekly chart. A falling trend was identified in early January Disclaimer: Direct investing in the stock market can result in financial loss. Historical results are no guarantee of future returns. No representation is being made that any account will or is likely to achieve profits or losses similar to those shown. Stock tips or ‘buy’ or sell recommendations are not provided. This educational information is not designed to replace your Licensed Financial Consultant or your Stockbroker. It has been prepared without regard to any particular person's investment objectives, financial situation and particular needs. This information is of a general nature only so you should seek advice from your broker or other investment advisors as appropriate before taking any action. The decision to trade and the method of trading is for the reader alone to decide. Avestra Securities Pty Ltd (Avestra) AFSL 292464, and ShareTradingEducation.com (“STE”), as Corporate Authorized Representative of Avestra, disclaims all liability of Avestra, STE and its Associates for any loss or damage suffered by any person by reason of the use by that person of, or their reliance on any information contained herein, whether arising from the negligence of Avestra, STE or its Associates or otherwise. Refer also to the full disclaimer at the back of each newsletter Edition and our Terms of Use. How to Write Your Own Stock & Futures Trading Plan Copyright© 2008 Tim Wilcox, Jim Berg, John Atkinson & Sharetradingeducation.com 44 2008 and the newsletter notional portfolio was closed on January 7th, 2008 before the substantial decline in prices. 9.6 What Will You Do Today – Hour by Hour? If you do not plan each day hour by hour, chances are that you will just drift. This could result in missed opportunities or, worse still, departing from your plan and taking ‘boredom trades’. Providing structure to your day encourages discipline, maintains focus and ensures that your work time is used to maximum effect. Be sure to factor in regular breaks from your computer with specific times for eating to discourage snacking! TW: As a U.S. day trader, I have a daily diary which . . . (covers the market hour by hour. Before 12.00 noon GMT is free time for relaxing, checking out threads on T2W etc. 12.00 noon – have lunch, 1.00pm – undertake the tasks outlined in parts 9.2 to 9.5 of my plan. 2.00pm – prepare for the open; search for opening gap plays and load alerts. 2.30pm – trade the open. 2.45pm – search for potential 3 o’clock reversal plays. So on and so forth throughout the rest of the day). JB: One of the major reasons I became a full time trader was to thoroughly enjoy the “lifestyle” that is possible - become independent, no retirement age, set my own hours, work from home, a boat, or a resort in any country in the world. I designed trading strategies that suited my personality and philosophy and that could be used by people with real, 9-5 jobs. Many people believe they need to retire to trade successfully. I wanted to teach people that they could download their data in the evening, analyze the markets, prepare for trading the following day and still spend the majority of the evening with their family, or other activities of their choosing. Longer term, conservative investors do not need to plan their day around the markets, watching a screen hour after hour. 9.7 Which Instruments are on Your Watch List? Finally, you can start to look for today’s trading opportunities. Scan your universe of instruments and split the results according to the strategies that you employ. For example, if you are a day trader, you may have a ‘retracement’ strategy to trade the open, followed by a ‘breakout’ strategy after the first half hour or so and, finally, a ‘reversal’ strategy for the evening session. TW: I will scan my universe of instruments in order to . . . (select candidates for the strategies that I employ. Auditory and/or visual alerts will be set for entry and exit signals). I will update the charts for all the instruments on my watch list showing . . . (key resistance and support levels, yesterday’s open, high, low and close etc). JB: The watch lists I use mainly for our newsletter notional portfolio are the same ones I use for my own personal investing, as follows: 1) Rising sector (weekly). Rising Share (weekly). Meets fundamental criteria 2) Rising share (weekly), RSI (7) oversold and Volatility Entry (daily) Disclaimer: Direct investing in the stock market can result in financial loss. Historical results are no guarantee of future returns. No representation is being made that any account will or is likely to achieve profits or losses similar to those shown. Stock tips or ‘buy’ or sell recommendations are not provided. This educational information is not designed to replace your Licensed Financial Consultant or your Stockbroker. It has been prepared without regard to any particular person's investment objectives, financial situation and particular needs. This information is of a general nature only so you should seek advice from your broker or other investment advisors as appropriate before taking any action. The decision to trade and the method of trading is for the reader alone to decide. Avestra Securities Pty Ltd (Avestra) AFSL 292464, and ShareTradingEducation.com (“STE”), as Corporate Authorized Representative of Avestra, disclaims all liability of Avestra, STE and its Associates for any loss or damage suffered by any person by reason of the use by that person of, or their reliance on any information contained herein, whether arising from the negligence of Avestra, STE or its Associates or otherwise. Refer also to the full disclaimer at the back of each newsletter Edition and our Terms of Use. How to Write Your Own Stock & Futures Trading Plan Copyright© 2008 Tim Wilcox, Jim Berg, John Atkinson & Sharetradingeducation.com 3) Monopolies/near monopolies - Rising share (weekly), RSI (7) oversold and Volatility Entry (daily) 4) Takeover Targets - Rising share (weekly), RSI (7) oversold and Volatility Entry (daily). 5) Expert’s Picks - Rising share (weekly), RSI (7) oversold and Volatility Entry(daily). 45 These Watch Lists are included, along with others and my JB Volatility Indicators as part of my JB Premium Charts and JB Combo packages. They are not buy recommendations. Rather, they are my first starting point of reducing the number of potential stocks in which to trade or invest. I then apply my Technical Analysis criteria, as discussed in this ebook and our newsletter. Disclaimer: Direct investing in the stock market can result in financial loss. Historical results are no guarantee of future returns. No representation is being made that any account will or is likely to achieve profits or losses similar to those shown. Stock tips or ‘buy’ or sell recommendations are not provided. This educational information is not designed to replace your Licensed Financial Consultant or your Stockbroker. It has been prepared without regard to any particular person's investment objectives, financial situation and particular needs. This information is of a general nature only so you should seek advice from your broker or other investment advisors as appropriate before taking any action. The decision to trade and the method of trading is for the reader alone to decide. Avestra Securities Pty Ltd (Avestra) AFSL 292464, and ShareTradingEducation.com (“STE”), as Corporate Authorized Representative of Avestra, disclaims all liability of Avestra, STE and its Associates for any loss or damage suffered by any person by reason of the use by that person of, or their reliance on any information contained herein, whether arising from the negligence of Avestra, STE or its Associates or otherwise. Refer also to the full disclaimer at the back of each newsletter Edition and our Terms of Use. How to Write Your Own Stock & Futures Trading Plan Copyright© 2008 Tim Wilcox, Jim Berg, John Atkinson & Sharetradingeducation.com 46 CHAPTER 4 MONEY and RISK MANAGEMENT By Tim Wilcox, Jim Berg & John Atkinson • General Risk Management • Specific Risk Management • General Money Management • Specific Money Management Disclaimer: Direct investing in the stock market can result in financial loss. Historical results are no guarantee of future returns. No representation is being made that any account will or is likely to achieve profits or losses similar to those shown. Stock tips or ‘buy’ or sell recommendations are not provided. This educational information is not designed to replace your Licensed Financial Consultant or your Stockbroker. It has been prepared without regard to any particular person's investment objectives, financial situation and particular needs. This information is of a general nature only so you should seek advice from your broker or other investment advisors as appropriate before taking any action. The decision to trade and the method of trading is for the reader alone to decide. Avestra Securities Pty Ltd (Avestra) AFSL 292464, and ShareTradingEducation.com (“STE”), as Corporate Authorized Representative of Avestra, disclaims all liability of Avestra, STE and its Associates for any loss or damage suffered by any person by reason of the use by that person of, or their reliance on any information contained herein, whether arising from the negligence of Avestra, STE or its Associates or otherwise. Refer also to the full disclaimer at the back of each newsletter Edition and our Terms of Use. How to Write Your Own Stock & Futures Trading Plan Copyright© 2008 Tim Wilcox, Jim Berg, John Atkinson & Sharetradingeducation.com CHAPTER 4. 47 MONEY and RISK MANAGEMENT 10. Risk & Money Management 10.1 This is the crux of the whole document. Failure to apply sound risk and money management principles will, almost certainly, be financially ruinous. First of all, let us define the difference between risk and money management. Risk management focuses on the steps necessary to minimize losses by assessing market conditions, risk-reward, probability and the use of stop loss orders etc. Money management, on the other hand, focuses on the steps necessary to maximize profits by the use of trailing stops and adjusting position size etc. This is summed up perfectly in that giant of trading axioms: ‘cut your losses short (i.e. risk management) and let your profits run (i.e. ‘money management’). GENERAL RISK MANAGEMENT 10.2 What is Your Attitude Towards Risk? This may seem an odd question, but it is a good starting point to ensure that your feelings about risk are compatible with your trading style. David S. Nassar, in his book ‘How to Get Started in Electronic Day Trading’ has this to offer on the subject: “Think of the stock market as a nuclear reactor – the more you are exposed to radiation the greater the chance of getting burned. Market risk is measured by the amount of time you are in the market. It could be seconds, minutes, hours, days or weeks. The longer you are in the market the greater the chance something will go wrong. Therefore, the trading style that keeps you in the longest can also be the most risky”. Many traders will totally disagree with this and feel much happier and sleep better at night by holding medium to long-term positions. For them, trading momentum plays in volatile Nasdaq stocks intraday carries far too much risk. TW: My attitude can be summed up as being . . . (risk averse and always seeking to minimize risk wherever possible. I will achieve this via diversification and adhering strictly to the risk management regime contained in this section of my trading plan). JB: I am a long term conservative investor minimizing risk through diversification and strict risk management rules. 10.3 What is the Overall Market Risk? Now decide the maximum amount of capital that you will put at risk at any one time. Be prepared for the worst. In the event of another market crash like ’87 or a terrorist attack like 9/11, having too much of your equity committed to the market could result in catastrophic loss. Disclaimer: Direct investing in the stock market can result in financial loss. Historical results are no guarantee of future returns. No representation is being made that any account will or is likely to achieve profits or losses similar to those shown. Stock tips or ‘buy’ or sell recommendations are not provided. This educational information is not designed to replace your Licensed Financial Consultant or your Stockbroker. It has been prepared without regard to any particular person's investment objectives, financial situation and particular needs. This information is of a general nature only so you should seek advice from your broker or other investment advisors as appropriate before taking any action. The decision to trade and the method of trading is for the reader alone to decide. Avestra Securities Pty Ltd (Avestra) AFSL 292464, and ShareTradingEducation.com (“STE”), as Corporate Authorized Representative of Avestra, disclaims all liability of Avestra, STE and its Associates for any loss or damage suffered by any person by reason of the use by that person of, or their reliance on any information contained herein, whether arising from the negligence of Avestra, STE or its Associates or otherwise. Refer also to the full disclaimer at the back of each newsletter Edition and our Terms of Use. How to Write Your Own Stock & Futures Trading Plan Copyright© 2008 Tim Wilcox, Jim Berg, John Atkinson & Sharetradingeducation.com 48 Many traders will not risk more than 1% on any one trade, with a maximum exposure on all open positions of 5% in total. In other words, if all the positions you have open at any one time were stopped out simultaneously, the drawdown on your account would not exceed 5%. Nasty, but not disastrous. TW: My maximum exposure in the market will . . . (not exceed a combined total of 5% of my capital at any one time). JB: Speaking from very hard personal experience, in his ebook ‘Ten Secrets to Profitable Online Stock & Share Trading’ John Atkinson says: “What we also failed to realize was that instead of spreading our risk, we were magnifying our risk. For instance, using a stop loss of 2% portfolio risk, let’s say a trader has ten positions. That means if the market takes a sudden dive and all stops are triggered, they risk losing 20% of their entire portfolio value. Expand that out to twenty positions, then 20 x 2% = 40% of their portfolio is at risk. It can happen – it did happen. If you freeze or have margin loans, the destruction can be far worse…. Dr Elder refers to the 2% risk rule as protection against shark attack and extends the concept further to a 6% rule to protect against piranha attack i.e. to close out the whole portfolio if it drops by 6% in the past month. Taking this to its logical extension, Dr Elder describes how, using this strategy, also limits traders to three positions (at 2% risk) to start off with, until some of them rise into profit, before opening any additional positions.” My own personal maximum risk is 2% on any one trade and maximum exposure on all open positions will not exceed 6%. For our notional newsletter portfolios which have a notional starting value of $100,000, we have elected to reduce the risk on any one trade to 1%. Some readers may choose to adopt a different value e.g. in his books Daryl Guppy also uses a maximum of 2%. Other investors with larger portfolios may choose to reduce this to 0.5%. The maximum exposure on all combined open positions will not exceed 6% of each respective portfolio. 10.4 What is the Sector Risk? Anyone who saw the fictional television drama ‘The Man Who Broke Britain’ (09/12/2004 on BBC2) will recall what happened to the city trader who was over extended in a bank that traded oil futures very heavily. She, and the bank, did well until terrorists blew up the world’s largest oil refinery. Oops! No fat cat bonus for the city trader and, ultimately, no job. One way to control sector risk is to limit the number of positions in any one sector. Disclaimer: Direct investing in the stock market can result in financial loss. Historical results are no guarantee of future returns. No representation is being made that any account will or is likely to achieve profits or losses similar to those shown. Stock tips or ‘buy’ or sell recommendations are not provided. This educational information is not designed to replace your Licensed Financial Consultant or your Stockbroker. It has been prepared without regard to any particular person's investment objectives, financial situation and particular needs. This information is of a general nature only so you should seek advice from your broker or other investment advisors as appropriate before taking any action. The decision to trade and the method of trading is for the reader alone to decide. Avestra Securities Pty Ltd (Avestra) AFSL 292464, and ShareTradingEducation.com (“STE”), as Corporate Authorized Representative of Avestra, disclaims all liability of Avestra, STE and its Associates for any loss or damage suffered by any person by reason of the use by that person of, or their reliance on any information contained herein, whether arising from the negligence of Avestra, STE or its Associates or otherwise. Refer also to the full disclaimer at the back of each newsletter Edition and our Terms of Use. How to Write Your Own Stock & Futures Trading Plan Copyright© 2008 Tim Wilcox, Jim Berg, John Atkinson & Sharetradingeducation.com 49 TW: My maximum exposure in any one sector will . . . (not exceed a combined total of 3% of my capital at any one time). JB: For the notional long term investing portfolio, our maximum exposure in any one sector will be 30% of the total ‘capital’. As clarification, this is not comparable with the 3% mentioned by TW as he is referring to the total risk and not the total purchase price. We monitor and check that the 30% sector criterion is not exceeded by using the Atkinson Portfolio Planner prior to ‘purchase’. 10.5 What is the Broker and Hardware Risk? Suppose your broker goes down and you have no way of closing your positions. How will you handle this scenario? Similarly, what will you do if you need to take action when (not if!) your PC crashes? TW: My main broker is . . . (FleeceEm.com and my back up broker is Doolittle & Dally. In extreme circumstances when my main broker is down, I have the option of hedging my positions with my other broker). In the event that my PC crashes . . . (I have a back up PC with a dial up modem connection and all my data is backed up daily onto CD. Additionally, I always have my mobile on and fully charged while trading, with numbers of the key departments of both brokers stored in the memory). JB: Personally I trade through the internet and have the option of phone orders as a backup. All data/trading information is located on two computers and I have a mobile phone for emergencies. In 9.4 we detailed how we will also report, from time to time, on outcomes of using the equivalent of a Conditional Stop Loss Ordering facility. John has found that unlike many other conditional stop loss brokers who rely totally on full automation, the use of manual intervention helps protect clients from having their shares automatically dumped unnecessarily in times of computerized stop loss selling. As described in 9.4, John Atkinson has termed this ‘avalanche selling’ in his two ebooks, the ‘Atkinson-Guppy Articles’ and ‘ 10 Secrets to Profitable Online Stock & Share Trading’ . 10.6 What is the Strategy Risk? The markets are constantly changing and a strategy that was profitable last month / year may not be profitable next month / year. There are ways of monitoring this that are discussed in unit 13 ‘After the Market Closes . . .’ However, as a long stop, prepare for the ultimate risk – the one that probably will happen sooner or later. Namely, your once brilliant and hugely profitable trading strategy no longer works! Control this by measuring the largest % drawdown on each strategy employed. Multiply this by a factor of 1.5 to 2, and if the drawdown ever exceeds this figure, STOP trading the strategy immediately! Disclaimer: Direct investing in the stock market can result in financial loss. Historical results are no guarantee of future returns. No representation is being made that any account will or is likely to achieve profits or losses similar to those shown. Stock tips or ‘buy’ or sell recommendations are not provided. This educational information is not designed to replace your Licensed Financial Consultant or your Stockbroker. It has been prepared without regard to any particular person's investment objectives, financial situation and particular needs. This information is of a general nature only so you should seek advice from your broker or other investment advisors as appropriate before taking any action. The decision to trade and the method of trading is for the reader alone to decide. Avestra Securities Pty Ltd (Avestra) AFSL 292464, and ShareTradingEducation.com (“STE”), as Corporate Authorized Representative of Avestra, disclaims all liability of Avestra, STE and its Associates for any loss or damage suffered by any person by reason of the use by that person of, or their reliance on any information contained herein, whether arising from the negligence of Avestra, STE or its Associates or otherwise. Refer also to the full disclaimer at the back of each newsletter Edition and our Terms of Use. How to Write Your Own Stock & Futures Trading Plan Copyright© 2008 Tim Wilcox, Jim Berg, John Atkinson & Sharetradingeducation.com 50 TW: I will monitor the drawdown on all my trading strategies. In the event that the drawdown exceeds 10%, I will stop trading immediately and review my trading strategy. JB: As discussed in 10.3, our notional portfolios will be ‘closed’ if the drawdown of the total portfolio exceeds 6% from its most recent closing high in any one month. If this occurs, we watch the market from the sidelines with our remaining notional ‘capital’ protected - until we consider that market conditions have improved. SPECIFIC RISK MANAGEMENT 10.7 What is the Probability of a Successful Trade? When it comes to assessing the specific risk associated with a proposed trade, most traders focus only on the risk-reward ratio. Unfortunately, this is somewhat meaningless unless probability is factored into the equation. Here is the reason why: suppose one determines the risk-reward ratio to be 4:1 – a gain of 80 points while only risking 20. In isolation, this looks excellent. However, if the probability of a trade being successful is only – say 20%, i.e. the probability of a 20 point loss is 80%, suddenly the proposed trade does not look quite so attractive! To assess the probability of success of a trading strategy we must start by defining the trade setup. This needs to be extremely precise, unambiguous and crystal clear. This is vital in order to spot the setup in real time, trading with real money. Once the setup is defined, it can then be back and forward tested to see if the probability of its success outweighs the probability of its failure. To complicate matters, there are numerous variables that will, between them, influence the outcome. Try to isolate these variables at the back testing stage by studying historical charts to see what they have in common. For example, the setup may have a higher probability of success if it appears just above a round number (for a long position) than it does if it appears just beneath it. Try to keep it simple. Do not get bogged down in the details of the trade (i.e. entry trigger, stop loss placement and exit strategy etc.) when defining and then testing the setup. Eventually, if the definition of the setup is precise enough and the testing of it is rigorous enough, it should be possible to assess the number of profitable trades relative to the number of unprofitable ones. This is often referred to as the ‘Success’ ratio and can be expressed as a percentage by dividing the total number of profitable trades by the total number of trades made (winners and losers) and multiplying by 100. TW: My setup(s) is . . . (clearly defined in section 12.3 of my plan and I am so familiar with it that I can spot it in real time instantly. Extensive back testing and forward testing by paper trading provides consistent data that indicates the setup has a probability (i.e. Success ratio) of X%). JB: My setup targets stocks/shares in a rising trend on a weekly chart. I then look for RSI oversold conditions in a rising market. I use my volatility entry advisor to signal the entry level (refer Question 12). Disclaimer: Direct investing in the stock market can result in financial loss. Historical results are no guarantee of future returns. No representation is being made that any account will or is likely to achieve profits or losses similar to those shown. Stock tips or ‘buy’ or sell recommendations are not provided. This educational information is not designed to replace your Licensed Financial Consultant or your Stockbroker. It has been prepared without regard to any particular person's investment objectives, financial situation and particular needs. This information is of a general nature only so you should seek advice from your broker or other investment advisors as appropriate before taking any action. The decision to trade and the method of trading is for the reader alone to decide. Avestra Securities Pty Ltd (Avestra) AFSL 292464, and ShareTradingEducation.com (“STE”), as Corporate Authorized Representative of Avestra, disclaims all liability of Avestra, STE and its Associates for any loss or damage suffered by any person by reason of the use by that person of, or their reliance on any information contained herein, whether arising from the negligence of Avestra, STE or its Associates or otherwise. Refer also to the full disclaimer at the back of each newsletter Edition and our Terms of Use. How to Write Your Own Stock & Futures Trading Plan Copyright© 2008 Tim Wilcox, Jim Berg, John Atkinson & Sharetradingeducation.com 51 Extensive back testing and forward testing by paper trading provides consistent data that indicates the setup has a probability (i.e. Success ratio) of around 65%. However, we must stress here that historical results are no guarantee of future returns. Please refer to the disclaimers in this ebook and the Terms of Use at www.sharetradingeducation.com. 10.8 What is the Risk-Reward Ratio? To determine the risk-reward ratio, we need to know the ‘Success’ ratio or probability ratio described in 10.7, above and the ‘Sharpe’ ratio. The latter is the average number of £££'s made on profitable trades, relative to the average number of £££'s lost on unprofitable trades. To express this as a percentage, divide the average £££'s gained on profitable trades by the combined figure of the average number of £££'s gained and lost and then multiply by 100. For the sake of argument, let us suppose that we have a Success ratio of 2:1 - i.e. a probability of success of 66%. Additionally, we also have a Sharpe ratio of say, 1.5:1 - so that if we risk £40.00 we stand to make £60.00 on the winning trades. The Success ratio tells us that we win 2 out of every 3 trades and the Sharpe ratio tells us that, of the 2 winners, we make 2 x +£60.00 = +£120.00. Our one losing trade of the three costs us -£40.00. On all three trades we risked £40.00 and ended up with a net gain of +£80.00. Therefore, if we divide the net gain by the amount we risked, we arrive at a risk-reward ratio of 2:1. However, a word of caution: all of this assumes that we only trade the setups defined in our plan and that they have been thoroughly back and forward tested to determine their probability of success. TW: I have forward tested my strategy initially by paper trading it and subsequently by using very small sums of money in live trading. The results enable me to determine . . . (a ‘Success’ ratio of 2:1 or better and a ‘Sharpe’ ratio of 1.5:1 or better. Therefore, I have calculated my risk-reward ratio to be in the order of 2:1 or better). JB: Another viewpoint of risk-reward is discussed by Daryl Guppy in his books. He and some other traders employ a rule that before entering a trade they will compare the minimum amount of profit they are targeting vs the amount of risk they are prepared to be exposed to. Then they will not enter a trade if the risk reward ratio is less than about 3 times. For trending ‘blue sky’ stocks this will not apply but we are mindful of the following, particularly when we have a list of potential trades. Comparisons like this help to optimize which trades to select. For example, suppose we had the following 3 alternative potential trades: Disclaimer: Direct investing in the stock market can result in financial loss. Historical results are no guarantee of future returns. No representation is being made that any account will or is likely to achieve profits or losses similar to those shown. Stock tips or ‘buy’ or sell recommendations are not provided. This educational information is not designed to replace your Licensed Financial Consultant or your Stockbroker. It has been prepared without regard to any particular person's investment objectives, financial situation and particular needs. This information is of a general nature only so you should seek advice from your broker or other investment advisors as appropriate before taking any action. The decision to trade and the method of trading is for the reader alone to decide. Avestra Securities Pty Ltd (Avestra) AFSL 292464, and ShareTradingEducation.com (“STE”), as Corporate Authorized Representative of Avestra, disclaims all liability of Avestra, STE and its Associates for any loss or damage suffered by any person by reason of the use by that person of, or their reliance on any information contained herein, whether arising from the negligence of Avestra, STE or its Associates or otherwise. Refer also to the full disclaimer at the back of each newsletter Edition and our Terms of Use. 52 How to Write Your Own Stock & Futures Trading Plan Copyright© 2008 Tim Wilcox, Jim Berg, John Atkinson & Sharetradingeducation.com Table 4.1 Risk-Reward Ratio Potential Trade No 1 2 3 Target Minimum trade profit 10% 30% 30% Planned Trade Risk# 15% 20% 10% Risk - Reward 0.7 1.5 3.0 #The Trade Risk is calculated as the difference between the planned entry price and the Initial Stop Loss Price divided by the entry price e.g. For an entry price of $3.00, Initial Stop Loss of $2.70: then Trade Risk = $3.00 -$2.70 x 100 = $0.30 x 100 = 10% $3.00 $3.00 In the above Table 4.1, again please note that we are discussing the % of the trade, not the % risk of the total portfolio. Regardless of how many stocks we were looking at, potential trade numbers 1 and 2 would be excluded immediately by this rule as the risk-reward factor is less than 3. In fact Trade 1 is actually showing a risk greater than the potential profit – a sure-fired recipe for potential disaster. Potential trade no 3 is the only one of the three shown above which would qualify as far as riskreward is concerned, if we were looking to select a stock as our next ‘investment’ using this rule. Figure 4.1 Atkinson Trade Optimizer From the user’s chosen criteria, the Atkinson Trade Optimizer (Figure 4.1) is a handy tool to compare and optimize the following outcomes for a list of potential trades: 1. Risk-reward ratios 2. Maximum position size 3. User’s elected position sizes and 4. Corresponding projected total portfolio growth for these position sizes. Disclaimer: Direct investing in the stock market can result in financial loss. Historical results are no guarantee of future returns. No representation is being made that any account will or is likely to achieve profits or losses similar to those shown. Stock tips or ‘buy’ or sell recommendations are not provided. This educational information is not designed to replace your Licensed Financial Consultant or your Stockbroker. It has been prepared without regard to any particular person's investment objectives, financial situation and particular needs. This information is of a general nature only so you should seek advice from your broker or other investment advisors as appropriate before taking any action. The decision to trade and the method of trading is for the reader alone to decide. Avestra Securities Pty Ltd (Avestra) AFSL 292464, and ShareTradingEducation.com (“STE”), as Corporate Authorized Representative of Avestra, disclaims all liability of Avestra, STE and its Associates for any loss or damage suffered by any person by reason of the use by that person of, or their reliance on any information contained herein, whether arising from the negligence of Avestra, STE or its Associates or otherwise. Refer also to the full disclaimer at the back of each newsletter Edition and our Terms of Use. How to Write Your Own Stock & Futures Trading Plan Copyright© 2008 Tim Wilcox, Jim Berg, John Atkinson & Sharetradingeducation.com 53 Risk-reward is a factor not usually examined under my approach but is shown here for those who choose to use it. Rather, my over-riding rule is such that the maximum planned risk shall be not greater than 10% of the position size. This is so that if the trade is sold at a 10% loss, it will only need an 11% recovery on the next trade to make up the loss. Compare this with the psychological and technical challenge of a 50% trade loss which would need a 100% profit on the next trade(s) to recover capital – see 10.9 below. In the examples above, potential trade numbers 1 and 2 with planned trade risks of 15% and 20% would therefore have been excluded using this rule too as they are both greater than the 10% JB Trade Risk limit. 10.9 What is Your Risk Per Trade? Fact: being able to predict market direction 99% of the time is useless if you risk 100% of your equity on every trade. You could make a fortune but, eventually, you WILL lose everything! Many traders will not risk more than 1% of their total equity on any one trade, unless their account size is very small - then this figure may rise to around 3%. TW: For every trade I enter, I will not risk more than 2% of my total equity or commit more than 10% of equity. For each trade I will identify the ideal stop loss point and vary the number of contracts/shares to ensure that I do not risk more than 2%. JB: As discussed in 10.3 above, for our notional portfolios, each with a starting value of $100,000, we have elected to reduce the risk on any one trade to 1% of portfolio value. We will set the initial and trailing stop losses using my ‘JB Premium Charts’ which includes my volatility based indicators. The cruelty of the market is such that mathematically, if a stock falls 20%, it needs to climb back 25% just to break even. A fall of 50% would need to make a 100% just to regain its original price e.g. $10 to $5 is half price, requiring another $5 or 100% to get back to $10. For this reason, I aim to keep my losses small - not only in terms of the total portfolio risk - but also the individual trade loss. I will therefore only enter a trade if the potential fall between my proposed entry price and the initial stop loss price is less than 10% (refer 10.8). If the price difference is greater than 10%, then I either: ¾ Wait for a retracement to buy closer to the initial stop loss or ¾ Dismiss the stock and look for another opportunity. Disclaimer: Direct investing in the stock market can result in financial loss. Historical results are no guarantee of future returns. No representation is being made that any account will or is likely to achieve profits or losses similar to those shown. Stock tips or ‘buy’ or sell recommendations are not provided. This educational information is not designed to replace your Licensed Financial Consultant or your Stockbroker. It has been prepared without regard to any particular person's investment objectives, financial situation and particular needs. This information is of a general nature only so you should seek advice from your broker or other investment advisors as appropriate before taking any action. The decision to trade and the method of trading is for the reader alone to decide. Avestra Securities Pty Ltd (Avestra) AFSL 292464, and ShareTradingEducation.com (“STE”), as Corporate Authorized Representative of Avestra, disclaims all liability of Avestra, STE and its Associates for any loss or damage suffered by any person by reason of the use by that person of, or their reliance on any information contained herein, whether arising from the negligence of Avestra, STE or its Associates or otherwise. Refer also to the full disclaimer at the back of each newsletter Edition and our Terms of Use. How to Write Your Own Stock & Futures Trading Plan Copyright© 2008 Tim Wilcox, Jim Berg, John Atkinson & Sharetradingeducation.com 54 As a third limit, the maximum we will place in any individual trade is 15% of the total portfolio value at any given time. All 3 of these rules are summarized in Question 10.13. 10.10 Where Will You Place Your Stop Loss Orders? Every trade you make MUST have a stop loss. Unless you are a seasoned professional trader, make sure it is an actual pending stop order in the market, NOT a mental stop! This will ensure that all losses are cut short. Also, if at all possible, make it market controlled and not a fixed percentage (i.e. 2%) of your equity. E.g., if you trade pullbacks, and your strategy dictates that you place your stop loss just below the low of the pullback, then that is where it should go. Vary the number of contracts / shares to ensure that you remain within the risk per trade parameters defined in 10.9, above. Admittedly, this can be tricky to achieve on small accounts. TW: For every trade I enter, I will decide in advance where to place my stop loss in the event that the trade goes against me. I trade retracements in a rising market and place my stop under the recent low of the pullback. JB: Our strategy for each notional trade selected for our notional portfolios is: 1. To set an Initial Stop set under the most recent low. This will be determined prior to entry and used to calculate our position size so that we do not place more then 1% of our capital at risk (refer 10.3) 2. Once the stock moves in our direction we will ratchet up the stop loss, using the JB Trailing Stop Loss. We trail the stop loss below the price action so that if prices retrace we will close out at a profit. The details on how and when this is done are explained further in Questions 11.7 to 11.10. 10.11 When Will You Stop Trading? Knowing when to stop trading is both good discipline and good risk management. Additionally, it helps to prevent chasing losses on losing days and helps to prevent greed from rearing its ugly head on winning days. Every single trading day should end in one of three ways, namely: 1. On a winning day, you have a very simple rule for stopping trading once you have reached your target. 2. On a losing day, you have a daily stop and cease trading as soon as it is hit. 3. Some days there are not any trading opportunities to be had, so you do not trade at all. Disclaimer: Direct investing in the stock market can result in financial loss. Historical results are no guarantee of future returns. No representation is being made that any account will or is likely to achieve profits or losses similar to those shown. Stock tips or ‘buy’ or sell recommendations are not provided. This educational information is not designed to replace your Licensed Financial Consultant or your Stockbroker. It has been prepared without regard to any particular person's investment objectives, financial situation and particular needs. This information is of a general nature only so you should seek advice from your broker or other investment advisors as appropriate before taking any action. The decision to trade and the method of trading is for the reader alone to decide. Avestra Securities Pty Ltd (Avestra) AFSL 292464, and ShareTradingEducation.com (“STE”), as Corporate Authorized Representative of Avestra, disclaims all liability of Avestra, STE and its Associates for any loss or damage suffered by any person by reason of the use by that person of, or their reliance on any information contained herein, whether arising from the negligence of Avestra, STE or its Associates or otherwise. Refer also to the full disclaimer at the back of each newsletter Edition and our Terms of Use. How to Write Your Own Stock & Futures Trading Plan Copyright© 2008 Tim Wilcox, Jim Berg, John Atkinson & Sharetradingeducation.com 55 TW: 1. Upon reaching my daily target I will stop trading . . . (after the first losing trade). 2. Before reaching my daily target I will stop trading . . . (after two losing trades). To ensure further that my losses are kept to a minimum, I will . . . (have a maximum daily stop of 3% of my equity). 3. I will not trade at all on days where . . . (I do not see the setups and entry triggers, exactly as specified in my plan). JB: 1 For our notional short term trading portfolio, when certain conditions are met and the closing price is above the JB Profit Taker, I will place an order to exit the position on the following day (refer Questions 11.11 and 12) 2. I enter the market after a correction. Retracements in a rising market usually have a reduction in volatility. After my entry, a rise in volatility often thrusts prices sharply higher. The initial stop is used because a subsequent correction is also often volatile and could thrust below a trailing stop. The trailing stop takes over from the initial stop once prices rise above the initial thrust that occurred after entry (refer 11.11) 3. When prices close for just one period below the initial stop (i.e. 1 week for long term investing and 1 day for short term trading), I will place an order to exit the position on the following day (refer 11.8) 4. When prices close two consecutive periods (as defined above) below the JB Trailing Stop I will place an order to exit the position on the following day (refer 11.9) 5. I remain disciplined at all times. I will not place any orders when my indicators do not generate entry or exit signals. GENERAL MONEY MANAGEMENT 10.12 Large Drawdowns and Profits – What Will You do? Your trading capital must be money that you can afford to lose and be set aside from everyday expenses. If you lost the lot, it should make no difference to your standard of living. Clearly define in your plan the extent to which you will credit additional funds to your account in the event of large draw downs and debit the account when it starts to burst at the seams with huge profits! TW: In the event of a large drawdown, I will . . . (only credit additional funds to my account with ‘spare’ money that I can afford to lose. I will not commence trading again until I have identified the cause of the drawdown and have re-tested the strategy to ensure that it meets my profit objectives). When my trading equity exceeds the amount I need to trade my strategies, I will . . . (withdraw the surplus and give it all to that great bloke from T2W called ‘timsk’ who started that thread . . !) Disclaimer: Direct investing in the stock market can result in financial loss. Historical results are no guarantee of future returns. No representation is being made that any account will or is likely to achieve profits or losses similar to those shown. Stock tips or ‘buy’ or sell recommendations are not provided. This educational information is not designed to replace your Licensed Financial Consultant or your Stockbroker. It has been prepared without regard to any particular person's investment objectives, financial situation and particular needs. This information is of a general nature only so you should seek advice from your broker or other investment advisors as appropriate before taking any action. The decision to trade and the method of trading is for the reader alone to decide. Avestra Securities Pty Ltd (Avestra) AFSL 292464, and ShareTradingEducation.com (“STE”), as Corporate Authorized Representative of Avestra, disclaims all liability of Avestra, STE and its Associates for any loss or damage suffered by any person by reason of the use by that person of, or their reliance on any information contained herein, whether arising from the negligence of Avestra, STE or its Associates or otherwise. Refer also to the full disclaimer at the back of each newsletter Edition and our Terms of Use. How to Write Your Own Stock & Futures Trading Plan Copyright© 2008 Tim Wilcox, Jim Berg, John Atkinson & Sharetradingeducation.com 56 JB: In direct contrast to TW’s viewpoint, we do not share the view that you should trade or invest money you ‘can afford to lose’. We tend to move towards our most dominant thought. Psychologically, we are at risk of doing exactly that i.e. losing most or all of our funds if we programme ourselves with this belief. Rather, we acknowledge that investing or trading is a psychological activity, supported by strong money and risk management. Many readers look to our newsletter for education to learn and then adapt and develop their own strategies for investing their funds to suit their personality and profile. The aim is that they will learn sufficient to survive initially, then to grow their portfolios with sound risk management in place. Again we must stress that we do not give advice or recommendations. We also point our readers to the disclaimers posted in this ebook and our newsletter. The ultimate decisions are left with the reader. For most of our readers, we assume that their funds, like ours, are not those that they are ‘prepared to lose. However we acknowledge that not all trades will be profitable. In fact, as stated in 10.7, with a success rate of 65% that means by definition we know before we even start the notional portfolios that approximately 35% of trades overall will be unprofitable. However, experienced investors and traders understand that two of the main keys to long term survival and profitability in the market are controlling losses, while maximizing profits. This may be achieved by either “letting profits run” - usually through holding long term in strong uptrends- or by successfully completing a high percentage of quick and profitable trades in the short term (refer Question 12). In his ebook ‘The Atkinson-Guppy Articles’ John Atkinson provides details on the importance of analyzing completed trades in terms of ‘Expectancy’ as first described in Dr Van Tharp’s book ‘Trade Your Way to Financial Freedom’. This is a factor which examines the % of winning trades vs losing trades and the amount of the average gain of winning trades compared with the average loss per losing trade. Many traders and investors take their profits, particularly when substantial, and move them to the relative safety of the bank. Others choose to compound their profits, in the hope of reflecting the compound interest graphs often shown in brokers’ literature. The former offers more security and safety in the market and may be likened to a small animal scurrying out from its burrow for food, then racing back down its hole - away from the risk of attack from birds, reptiles and other animals. In contrast, at first thought, compounding has the potential to accelerate returns. However by having all funds exposed at any time, it is a two edged sword - as it also has the potential to accelerate losses. Disclaimer: Direct investing in the stock market can result in financial loss. Historical results are no guarantee of future returns. No representation is being made that any account will or is likely to achieve profits or losses similar to those shown. Stock tips or ‘buy’ or sell recommendations are not provided. This educational information is not designed to replace your Licensed Financial Consultant or your Stockbroker. It has been prepared without regard to any particular person's investment objectives, financial situation and particular needs. This information is of a general nature only so you should seek advice from your broker or other investment advisors as appropriate before taking any action. The decision to trade and the method of trading is for the reader alone to decide. Avestra Securities Pty Ltd (Avestra) AFSL 292464, and ShareTradingEducation.com (“STE”), as Corporate Authorized Representative of Avestra, disclaims all liability of Avestra, STE and its Associates for any loss or damage suffered by any person by reason of the use by that person of, or their reliance on any information contained herein, whether arising from the negligence of Avestra, STE or its Associates or otherwise. Refer also to the full disclaimer at the back of each newsletter Edition and our Terms of Use. How to Write Your Own Stock & Futures Trading Plan Copyright© 2008 Tim Wilcox, Jim Berg, John Atkinson & Sharetradingeducation.com 57 This can occur if there is an overall market drop and the investor does not have stop losses in place – or does not action these stops with discipline when they are triggered. A 10 or 15% sudden correction across the market, if applied across a portfolio, would result in a corresponding or sometimes greater fall in total open portfolio value - as some individual stocks may fall by more than the index benchmark. We believe compounding should only be employed by investors who are well disciplined and have a structured Trading Plan in place, including the use of sound money and risk management procedures. For simplicity of reporting, we initially ignored any growth in the notional portfolio value and did not include any compounding effects. Since then, from time to time we have given examples of the power of compounding As discussed in 10.3 and 10.6, in the event of a large drawdown of 6% of value in portfolio values within a month, we will close them out and sit to the sidelines. 10.13 Which Money Management Approaches Will You Utilise? If you are starting with a small account, say £5,000 or less – what are your objectives? If, for example, you want to be a ‘pattern day trader’ (P.D.T.), your account will need to grow by at least 350% in order to achieve the $25,000 minimum necessary to open a P.D.T. account. As the profits come in, will you risk more per trade, diversify into other trading strategies or adopt a completely different approach? TW: As my trading account grows, I will . . . (increase my position size to a maximum of X contracts / shares whilst remaining within the parameters of my risk management strategy). JB: My style tends to be conservative and with a longer term focus. As posted at the new ‘Ask Jim Berg page’ at www.sharescene.com, I favour two main trading/investing strategies: 1) Long term conservative investing, combining technical and fundamental analysis. Common sense approach, using weekly charts to target rising sectors and healthy, low risk companies, as demonstrated in our newsletter long term portfolio. 2) Shorter term trading, targeting temporarily oversold conditions in rising markets for which I use volatility indicators for entry, trailing stop and profit taking with the intention of staying with a trade for a few days to a few weeks. For money management approaches we refer to our co-authored ebook ‘ 10 Secrets to Profitable Online Stock & Share Trading’ in which John Atkinson wrote: “Many investors and traders spend less time planning the risk of individual trades and their overall portfolio for their wealth creation than they do planning their grocery shopping. Many do not plan, accurately track or review their progress at all. Disclaimer: Direct investing in the stock market can result in financial loss. Historical results are no guarantee of future returns. No representation is being made that any account will or is likely to achieve profits or losses similar to those shown. Stock tips or ‘buy’ or sell recommendations are not provided. This educational information is not designed to replace your Licensed Financial Consultant or your Stockbroker. It has been prepared without regard to any particular person's investment objectives, financial situation and particular needs. This information is of a general nature only so you should seek advice from your broker or other investment advisors as appropriate before taking any action. The decision to trade and the method of trading is for the reader alone to decide. Avestra Securities Pty Ltd (Avestra) AFSL 292464, and ShareTradingEducation.com (“STE”), as Corporate Authorized Representative of Avestra, disclaims all liability of Avestra, STE and its Associates for any loss or damage suffered by any person by reason of the use by that person of, or their reliance on any information contained herein, whether arising from the negligence of Avestra, STE or its Associates or otherwise. Refer also to the full disclaimer at the back of each newsletter Edition and our Terms of Use. How to Write Your Own Stock & Futures Trading Plan Copyright© 2008 Tim Wilcox, Jim Berg, John Atkinson & Sharetradingeducation.com 58 Some think that spreading or ‘diversifying’ their portfolio into several large positions in 'safe' blue chips is their way to address money & risk management. They do not realize that overloading in too many positions or too large a position can put their portfolio seriously at risk. Without proper planning one may end up with a portfolio that is a disaster waiting to happen. We know. We've been there & we wouldn't want you to go through the sleepless nights and gut wrenching fear, financial and emotional loss that we and a few traders we know have experienced as a result A major reason why we lost our Sydney waterfront home in 2000 and more since was not developing or adhering to correct risk & money management rules - so our series of three portfolio tools has been created from our own personal very hard knock experience at a very real financial cost of literally hundreds of thousands of dollars and at a huge emotional cost…………. …………..Putting all or most of your available funds into one stock or sector; placing at risk a large % of one’s portfolio in any one position or having too many open positions with an unacceptable total % of portfolio at risk are recipes for potential disaster. Experience of other traders shows that it is also wise to diversify their capital in a chosen proportion between a range of high, medium and low volatility stocks to maximise annual growth of their portfolio. Experienced traders and investors have varying rules for money and risk management. The following are some typical examples from the literature: 1. In his books ‘Share Trading’ and ‘Better Trading’ and his newsletter Daryl Guppy chooses 1/7 (14.3%) in high volatility (e.g. ‘speculatives’); 2/7 (28.6%) in medium volatility (e.g. ‘mid caps’) and 4/7 (57.1%) in low volatility (e.g. ‘blue chips’). Others may choose a maximum of 10% in high volatility. The final choice is the user’s responsibility 2. For small portfolios, in his book Share Trading, Daryl Guppy also provides an example of building from $6k to $21k, by starting with $2k (i.e. 1/3rd) in high volatility and $4k (i.e. 2/3rd) in low volatility stocks; then splitting this back to 1/7; 2/7 and 4/7 when the portfolio has grown to $14k. 3. Maximum position size as a % of total portfolio: commonly 20-25% absolute max; some reduce to 15% or less for large portfolios or speculative stocks. 4. Maximum Equity Risk: No more than 2% of portfolio to be placed at risk in any one trade – some choose to reduce this to 1 % or 0.5% for larger portfolios or for more highly volatile positions………………………” Some traders split their portfolio allocation using total market capitalization of the companies as their delineating criterion, as per the following definitions: ¾ Large Caps – the S&P/ASX 50 Index (ASX code: XFL) The S&P/ASX 50 index comprises the 50 largest stocks by market capitalization in Australia. Disclaimer: Direct investing in the stock market can result in financial loss. Historical results are no guarantee of future returns. No representation is being made that any account will or is likely to achieve profits or losses similar to those shown. Stock tips or ‘buy’ or sell recommendations are not provided. This educational information is not designed to replace your Licensed Financial Consultant or your Stockbroker. It has been prepared without regard to any particular person's investment objectives, financial situation and particular needs. This information is of a general nature only so you should seek advice from your broker or other investment advisors as appropriate before taking any action. The decision to trade and the method of trading is for the reader alone to decide. Avestra Securities Pty Ltd (Avestra) AFSL 292464, and ShareTradingEducation.com (“STE”), as Corporate Authorized Representative of Avestra, disclaims all liability of Avestra, STE and its Associates for any loss or damage suffered by any person by reason of the use by that person of, or their reliance on any information contained herein, whether arising from the negligence of Avestra, STE or its Associates or otherwise. Refer also to the full disclaimer at the back of each newsletter Edition and our Terms of Use. 59 How to Write Your Own Stock & Futures Trading Plan Copyright© 2008 Tim Wilcox, Jim Berg, John Atkinson & Sharetradingeducation.com The constituent companies represent the biggest national and multi-national publicly listed companies in the Australian equity market. The S&P/ASX 50 index places an emphasis on liquidity and investability. The constituents of the index are reviewed quarterly using the previous six months data. The index forms the basis for the streetTRACKS S&P/ASX 50 exchange-traded fund, and the ASX mini50 futures contract. At June 30, 2002, the S&P/ASX 50 represented 75% of the market capitalization of domestic equities listed on the ASX. ¾ S&P/ASX MidCap 50 Index (ASX code: XMD) The S&P/ASX MidCap 50 index is comprised of companies within the S&P/ASX 100, but not those included in the S&P/ASX 50. The index provides a benchmark for large active managers where the emphasis is on having a portfolio with sufficient liquidity. The index represented approximately 10% of the total market capitalization of the Australian market at June 30 2002. c) S&P/ASX Small Ordinaries Index (ASX code: XSO) The S&P/ASX Small Ordinaries index is comprised of companies included in the S&P/ASX 300 index, but not in the S&P/ASX 100 index. This index provides a benchmark for small-cap investments. The index represented approximately 6% of the total market capitalization of the Australian market June 30 2002. Other traders may decide to trade only the shares which are in the ASX20, ASX100, ASX200 or ASX300 Some shares may fit our definitions as a ‘large cap’ but may be excessively volatile in relation to my rules. Such shares, e.g. Newscorp would not be considered as a Low Volatility ‘blue chip.’ To move past this challenge, we turn to Aspect Huntley, a well respected Agency which provides a ranking analysis for their newsletter subscribers on Companies listed on the ASX. The results are also tabulated on the Etrade site for the use of their clients and may be looked up under ‘Quotes and Research’ then click on ‘Profile’ At the time of writing this ebook, Aspect risk rankings could www.ninemsn.com.au: 1. Money 2. Shares & Funds 3. Find Shares 4. Search window – Aspect Ranks for all Companies 5. Search also be found at The following Table 4.1 shows the relative rankings assigned by Aspect Huntley for value, growth, income and risk. Disclaimer: Direct investing in the stock market can result in financial loss. Historical results are no guarantee of future returns. No representation is being made that any account will or is likely to achieve profits or losses similar to those shown. Stock tips or ‘buy’ or sell recommendations are not provided. This educational information is not designed to replace your Licensed Financial Consultant or your Stockbroker. It has been prepared without regard to any particular person's investment objectives, financial situation and particular needs. This information is of a general nature only so you should seek advice from your broker or other investment advisors as appropriate before taking any action. The decision to trade and the method of trading is for the reader alone to decide. Avestra Securities Pty Ltd (Avestra) AFSL 292464, and ShareTradingEducation.com (“STE”), as Corporate Authorized Representative of Avestra, disclaims all liability of Avestra, STE and its Associates for any loss or damage suffered by any person by reason of the use by that person of, or their reliance on any information contained herein, whether arising from the negligence of Avestra, STE or its Associates or otherwise. Refer also to the full disclaimer at the back of each newsletter Edition and our Terms of Use. 60 How to Write Your Own Stock & Futures Trading Plan Copyright© 2008 Tim Wilcox, Jim Berg, John Atkinson & Sharetradingeducation.com Table 4.1 Aspect Huntley Key Measures Key Measures Details Description 1 2 3 4 5 Value, Growth, Income Highest Above Average Average Below Average Lowest Risk Lowest Below Average Average Above Average Highest In particular, Aspect Financial explain on the Etrade Australia site that their “….Risk Ranking incorporates measures to assess both market risk and total risk. Market risk is determined by a company’s beta, which measures the volatility of a stock relative to the total market. Total risk is measured by the standard deviation of a company’s monthly share returns. Financial risk, which measures a company’s ability to meet its financial obligations, such as debt, is measured by a number of different ratios which are industry-specific. These are not explicitly contained in their overall risk rank. Share price volatility, however, is generally a good proxy of financial risk as the two are closely linked. In other words, companies with high debt to equity ratios relative to their industry peers will generally have more volatile earnings and stock prices. The rankings for each category are based on the position of each stock relative to all other stocks covered by Aspect. The rankings are recalculated every night based on the latest share prices, company financials and other data they receive. The distribution for all rankings is based on the following percentages: Rank 1 = best 10% 2 = next 20% 3 = middle 40% 4 = next 20% 5 = bottom 10%” From February 2006, for our long term investing portfolio, which we feature from time to time, we introduced the following rules (which were subsequently updated after July 2006, as detailed in Question 12.11): ¾ Use Jim Berg’s fundamental criteria as the first major filter ¾ For simplicity we tended towards allocating the distribution of large, medium and small caps as above. ¾ Then combine this with Aspect Financial Risk Assessments to only choose Companies with a Risk Ranking of 1 to 3 i.e. to ensure we do not include companies with above average Risk Disclaimer: Direct investing in the stock market can result in financial loss. Historical results are no guarantee of future returns. No representation is being made that any account will or is likely to achieve profits or losses similar to those shown. Stock tips or ‘buy’ or sell recommendations are not provided. This educational information is not designed to replace your Licensed Financial Consultant or your Stockbroker. It has been prepared without regard to any particular person's investment objectives, financial situation and particular needs. This information is of a general nature only so you should seek advice from your broker or other investment advisors as appropriate before taking any action. The decision to trade and the method of trading is for the reader alone to decide. Avestra Securities Pty Ltd (Avestra) AFSL 292464, and ShareTradingEducation.com (“STE”), as Corporate Authorized Representative of Avestra, disclaims all liability of Avestra, STE and its Associates for any loss or damage suffered by any person by reason of the use by that person of, or their reliance on any information contained herein, whether arising from the negligence of Avestra, STE or its Associates or otherwise. Refer also to the full disclaimer at the back of each newsletter Edition and our Terms of Use. 61 How to Write Your Own Stock & Futures Trading Plan Copyright© 2008 Tim Wilcox, Jim Berg, John Atkinson & Sharetradingeducation.com ¾ Then ensure they pass Jim Berg’s technical analysis criteria so that we trade with “weightof-evidence” i.e. the Company meets a number of fundamental and technical criteria before inclusion in the portfolio. For our notional long term investing portfolio we originally elected to use the following money and risk management profile: 1. Volatility grouping (max): i. Small caps/high volatility: ii. Medium volatility ‘midcaps’: iii. Low volatility ‘blue chips’: 12% 28% 60% 100% The above percentages are the maximum when fully invested. For much of the time we will have ‘cash’ available awaiting opportunities or when sitting to the sidelines during market downturns. The reason for this allocation apportionment was to place the majority of our notional ‘funds’ into the ‘elephants’ of the market. Then, to apportion the remainder between some other fundamentally sound companies with smaller capitalizations which may also help accelerate portfolio growth While retaining this allocation distribution in concept, from February 2006 we also placed, as an over-riding criterion, that every share chosen for our Long Term Investing portfolio must have an Aspect Risk Ranking of 1, 2 or a 3. For simplicity, as Etrade shows at a glance for each Company, the Aspect Rankings and the participation within the ASX20, 50, 100, 200 and 300, we also adopted the following apportionment definitions from February 2006 onwards, as shown in Table 4.2: Table 4.2 Long Term Investing Portfolio Allocation ‘Large caps’ ‘Midcaps’: ‘Small caps’ Index Participation ASX50 ASX midcap 50 Rest of market Aspect Risk ranking 1, 2 or 3 1, 2 or 3 1, 2 or 3 Apportionment 60% 28% 12% For instance, the following Table 4.3 shows a selection of some of the stocks we have included within our notional portfolio at various times. This table shows, for each stock, the Risk Ranking and the participation within the respective Indices. (Note these are shown for educational purposes only, are deliberately not necessarily current and are definitely not ‘buy’ recommendations) Disclaimer: Direct investing in the stock market can result in financial loss. Historical results are no guarantee of future returns. No representation is being made that any account will or is likely to achieve profits or losses similar to those shown. Stock tips or ‘buy’ or sell recommendations are not provided. This educational information is not designed to replace your Licensed Financial Consultant or your Stockbroker. It has been prepared without regard to any particular person's investment objectives, financial situation and particular needs. This information is of a general nature only so you should seek advice from your broker or other investment advisors as appropriate before taking any action. The decision to trade and the method of trading is for the reader alone to decide. Avestra Securities Pty Ltd (Avestra) AFSL 292464, and ShareTradingEducation.com (“STE”), as Corporate Authorized Representative of Avestra, disclaims all liability of Avestra, STE and its Associates for any loss or damage suffered by any person by reason of the use by that person of, or their reliance on any information contained herein, whether arising from the negligence of Avestra, STE or its Associates or otherwise. Refer also to the full disclaimer at the back of each newsletter Edition and our Terms of Use. 62 How to Write Your Own Stock & Futures Trading Plan Copyright© 2008 Tim Wilcox, Jim Berg, John Atkinson & Sharetradingeducation.com Table 4.3 Risk Rankings & Index Participation Ticker Code ORI BLD CML ASX WOW ALN ARQ Risk Ranking 3 3 1 2 1 1 3 ASX20 2.2% 3.8% - ENE 3 - Index participation ASX50 ASX100 ASX200 0.9% 0.8% 0.7% 0.7% 0.6% 0.6% 1.6% 1.4% 1.3% 0.4% 0.4% 2.8% 2.4% 2.3% 0.3% 0.3% 0.04% - - 0.05% Grouping ASX300 0.7% 0.5% 1.3% 0.4% 2.2% 0.3% 0.04% 0.05% Large cap Large cap Large cap Large cap Large cap Large cap Medium cap Medium cap Small Cap Small Cap LSG 2 0.02% CAB 2 0.04% 2. Maximum Position Size: The maximum we will place in any individual trade is 15% of the total portfolio value at any given time 3. Maximum Sector Risk: The maximum we will place in combined trades in any one sector is 30% of the total portfolio value at any given time 4. Maximum Equity Risk: No more than 1% of total portfolio value to be placed at risk in any one trade 5. Maximum Equity Risk: No more than 6% of total portfolio value to be placed at risk in all combined trades. Figure 4.2 Atkinson Portfolio Planner Disclaimer: Direct investing in the stock market can result in financial loss. Historical results are no guarantee of future returns. No representation is being made that any account will or is likely to achieve profits or losses similar to those shown. Stock tips or ‘buy’ or sell recommendations are not provided. This educational information is not designed to replace your Licensed Financial Consultant or your Stockbroker. It has been prepared without regard to any particular person's investment objectives, financial situation and particular needs. This information is of a general nature only so you should seek advice from your broker or other investment advisors as appropriate before taking any action. The decision to trade and the method of trading is for the reader alone to decide. Avestra Securities Pty Ltd (Avestra) AFSL 292464, and ShareTradingEducation.com (“STE”), as Corporate Authorized Representative of Avestra, disclaims all liability of Avestra, STE and its Associates for any loss or damage suffered by any person by reason of the use by that person of, or their reliance on any information contained herein, whether arising from the negligence of Avestra, STE or its Associates or otherwise. Refer also to the full disclaimer at the back of each newsletter Edition and our Terms of Use. How to Write Your Own Stock & Futures Trading Plan Copyright© 2008 Tim Wilcox, Jim Berg, John Atkinson & Sharetradingeducation.com 63 The above screenshot (Figure 4.2) is an extract from one of our newsletter portfolios. It shows a worked example of these various factors being applied to a group of notional trades, using the Atkinson Portfolio Planner©. These are not buy or sell recommendations. In particular, it shows that at that time we had: ¾ Two notional trades in the Materials Sector, totaling $25.4k i.e. approaching our 30% sector limit : and 2 trades in the Retailing sector totaling 21.9% ¾ No speculative shares ¾ $15k of our $28k allocation in mid caps. ¾ Had filled up our $60k allocation for ‘blue chips ¾ Two trades ORI & LSG at the maximum but not exceeding our 15% of portfolio limit ¾ No ‘open’ trades had a risk exposure greater than 1% ¾ The total portfolio risk of all open notional trades was 4.8% i.e. approaching our 6% ‘piranha attack’ limit In Chapter 3 we also mentioned that from time to time that we will trade Share Purchase Plans, as detailed in John Atkinson’s ‘The Atkinson-Guppy Articles’ As these are short term trades only, lasting a few weeks maximum at a time, we will look to have some notional Share Purchase Plan trades from time to time in our Short Term Trading Portfolio For these, we may trade ‘positions’ of up to $5,500 maximum for each of these Share Purchase Plans, paid as two ‘installments’, with a view to ‘selling’ them as soon as the main allocation of shares from the second ‘installment’ are received. This will generally be within about a month of initial ‘purchase’. We will identify possible candidates for Share Purchase Plans (SPP) from our broker’s email alerts from time to time and will only consider Share Purchase Plans: Of greater than 50c We may ‘buy’ the initial entitlement position if the share is in early recovery mode from a downtrend. However, we will only go on to later commit the larger installment if the share qualifies as being in an uptrend - as defined by Jim Berg’s Technical Analysis methods in his Home Study Courses ‘ With an open profit at the time of purchase of the second ‘installment’ of at least: o 10% for shares over $3; o 15% for shares over $1 and less than $3 o 25% for shares over 50c and less than $1 Disclaimer: Direct investing in the stock market can result in financial loss. Historical results are no guarantee of future returns. No representation is being made that any account will or is likely to achieve profits or losses similar to those shown. Stock tips or ‘buy’ or sell recommendations are not provided. This educational information is not designed to replace your Licensed Financial Consultant or your Stockbroker. It has been prepared without regard to any particular person's investment objectives, financial situation and particular needs. This information is of a general nature only so you should seek advice from your broker or other investment advisors as appropriate before taking any action. The decision to trade and the method of trading is for the reader alone to decide. Avestra Securities Pty Ltd (Avestra) AFSL 292464, and ShareTradingEducation.com (“STE”), as Corporate Authorized Representative of Avestra, disclaims all liability of Avestra, STE and its Associates for any loss or damage suffered by any person by reason of the use by that person of, or their reliance on any information contained herein, whether arising from the negligence of Avestra, STE or its Associates or otherwise. Refer also to the full disclaimer at the back of each newsletter Edition and our Terms of Use. How to Write Your Own Stock & Futures Trading Plan Copyright© 2008 Tim Wilcox, Jim Berg, John Atkinson & Sharetradingeducation.com 64 To ensure that we can easily ‘exit’ the SPP when allocated, we will also only select Share Purchase Plans for the notional Short Term Trading Portfolio which have an average daily volume over the past 30 days of at least $165,000 per day i.e. 30 x the value of the maximum SPP ‘purchase’ for this portfolio. Similarly, for other notional trades in both our notional portfolios, we will only select shares with average daily volumes over the past five days of at least ten times the notional position size. SPECIFIC MONEY MANAGEMENT 10.14 How Will You Lock In Profits? Using a trailing stop to lock in profits once the trade is on the right side of break-even has two clear advantages: 1. 2. At worst, you may end up with a scratch trade – but no losses. At best, it allows profits to run which enables you to take a sizeable chunk out of the expected move. TW: I will utilise a trailing stop which I will position . . . (x points below the lower high in an uptrend or y points above a higher low in a downtrend). JB: For our short term trading notional portfolio I use DAILY charts and our Short term strategy using the Berg Profit Taker and JB Volatility Trailing Stop. These are calculated at the end of each trading day (refer Question 12.6) For my long term portfolio, I update each of the notional trades on WEEKLY charts to show the position of the trailing stop loss as at the close of business on Friday. For the benefit of shorter term traders, for these stocks/shares we also provide extra education by separately showing: ¾ Daily charts and ¾ Short term trading strategies, as described in Question 12.8 and 12.9 ¾ Profit taking and stop loss exit strategies, using the Berg Profit Taker and JB Volatility Trailing Stop. It is not my intention to take profits using the Profit Taker for my longer term portfolio, as I prefer to use a trailing stop loss sufficiently below current price action to allow me to ride the trend for as long as possible. I acknowledge that this results in a delayed exit at the completion of the trend, compared with shorter term exit signals. The trade-off is designed to result in significantly reduced stress, ‘screen watching’ and hence trading activity meanwhile. Disclaimer: Direct investing in the stock market can result in financial loss. Historical results are no guarantee of future returns. No representation is being made that any account will or is likely to achieve profits or losses similar to those shown. Stock tips or ‘buy’ or sell recommendations are not provided. This educational information is not designed to replace your Licensed Financial Consultant or your Stockbroker. It has been prepared without regard to any particular person's investment objectives, financial situation and particular needs. This information is of a general nature only so you should seek advice from your broker or other investment advisors as appropriate before taking any action. The decision to trade and the method of trading is for the reader alone to decide. Avestra Securities Pty Ltd (Avestra) AFSL 292464, and ShareTradingEducation.com (“STE”), as Corporate Authorized Representative of Avestra, disclaims all liability of Avestra, STE and its Associates for any loss or damage suffered by any person by reason of the use by that person of, or their reliance on any information contained herein, whether arising from the negligence of Avestra, STE or its Associates or otherwise. Refer also to the full disclaimer at the back of each newsletter Edition and our Terms of Use. How to Write Your Own Stock & Futures Trading Plan Copyright© 2008 Tim Wilcox, Jim Berg, John Atkinson & Sharetradingeducation.com 65 10.15 How Will You Determine Your Position Size? The size of your position should never exceed the parameters specified in your risk management rules. That said, there are still many options available. Some strategies might have a high probability of success (e.g. trend continuation strategies) enabling you to adopt a more aggressive position size at entry. Other strategies might have a lower probability of success (e.g. reversal strategies) and your risk management criterion dictates a more conservative position size at entry. However, once the trade and the new trend are established, it may be advantageous to add to the position at specific continuation signals. Potentially, this allows for a large position size to accumulate, whilst all the time maintaining a very low exposure to risk. TW: I am a scalper so this approach does not apply to me! I am a swing trader and I will build my position by . . . (adding x contracts / No. of shares at the next ABC continuation pattern. After that I will add . . . ) JB: In our newsletter our notional short term trading portfolio is based on a standardized position size – see Question 12.7, based on a maximum loss of 1% of portfolio per trade. For the notional long term investing portfolio we use the Atkinson Trade Optimizer© to calculate the position size of notional trades so that if the trade triggers the pre-determined stop loss level, then no more than 1% of total portfolio value will be at risk, after allowing for brokerage. (refer 10.3 above). Figure 4.3 Position Size Optimization The Atkinson Optimizer (Figure 4.3) calculates the maximum number of stocks based on some of the main nominated portfolio risk parameters nominated in this Chapter. Disclaimer: Direct investing in the stock market can result in financial loss. Historical results are no guarantee of future returns. No representation is being made that any account will or is likely to achieve profits or losses similar to those shown. Stock tips or ‘buy’ or sell recommendations are not provided. This educational information is not designed to replace your Licensed Financial Consultant or your Stockbroker. It has been prepared without regard to any particular person's investment objectives, financial situation and particular needs. This information is of a general nature only so you should seek advice from your broker or other investment advisors as appropriate before taking any action. The decision to trade and the method of trading is for the reader alone to decide. Avestra Securities Pty Ltd (Avestra) AFSL 292464, and ShareTradingEducation.com (“STE”), as Corporate Authorized Representative of Avestra, disclaims all liability of Avestra, STE and its Associates for any loss or damage suffered by any person by reason of the use by that person of, or their reliance on any information contained herein, whether arising from the negligence of Avestra, STE or its Associates or otherwise. Refer also to the full disclaimer at the back of each newsletter Edition and our Terms of Use. How to Write Your Own Stock & Futures Trading Plan Copyright© 2008 Tim Wilcox, Jim Berg, John Atkinson & Sharetradingeducation.com 66 A separate sheet also allows the user to reduce the position size to match the user’s other requirements.This screenshot is a condensed extract from part of the Optimizer, without considering profit targets - as we do not consider these (and correspondingly Risk-Reward Ratios) for trending shares (see 10.8 above). The Optimizer shows that the initial calculations based on risking our maximum allocation of 1% of portfolio would have allowed us to ‘buy’ 1723 stocks for a total of $29.3k.However this would have exceeded another of our requirements, being that the most we will allocate to any one stock is 15% of our portfolio. The Optimizer has checked, found this challenge and notified us with the yellow and red warning that the position size is governed by the % of total portfolio rule.Accordingly, the Optimizer has then automatically reduced our notional position size to 879 shares - at a total cost of $15k including brokerage. This notional position size places a total of $569 of the notional Long term Investing portfolio at risk (including buy and sell brokerage) if prices drop from our entry point of $16.98 to our stop loss of $16.47. This equates to 0.6% of our notional capital at risk. The Atkinson Trade Optimizer confirms that the adjusted risk is now 0.6% i.e. this is within our allowable portfolio parameters for not exceeding our 1% risk rule - while also being within our maximum 15% of our total portfolio in any one stock i.e. $15k for a $100k portfolio. ______________________________________________________________________________ For more details on Money & Risk Management, refer to John Atkinson’s Home Study Course module on Money and Risk Management which is based on and includes Daryl Guppy’s ‘Share Trading’ & ‘Better Trading’ books and John Atkinson’s own Portfolio Management Tools at www .sharetradingeducation.com. Disclaimer: Direct investing in the stock market can result in financial loss. Historical results are no guarantee of future returns. No representation is being made that any account will or is likely to achieve profits or losses similar to those shown. Stock tips or ‘buy’ or sell recommendations are not provided. This educational information is not designed to replace your Licensed Financial Consultant or your Stockbroker. It has been prepared without regard to any particular person's investment objectives, financial situation and particular needs. This information is of a general nature only so you should seek advice from your broker or other investment advisors as appropriate before taking any action. The decision to trade and the method of trading is for the reader alone to decide. Avestra Securities Pty Ltd (Avestra) AFSL 292464, and ShareTradingEducation.com (“STE”), as Corporate Authorized Representative of Avestra, disclaims all liability of Avestra, STE and its Associates for any loss or damage suffered by any person by reason of the use by that person of, or their reliance on any information contained herein, whether arising from the negligence of Avestra, STE or its Associates or otherwise. Refer also to the full disclaimer at the back of each newsletter Edition and our Terms of Use. How to Write Your Own Stock & Futures Trading Plan Copyright© 2008 Tim Wilcox, Jim Berg, John Atkinson & Sharetradingeducation.com 67 CHAPTER 5 EXITS By Tim Wilcox & Jim Berg • Exit Strategies • Stop Loss Exits • The Berg Profit Taker Disclaimer: Direct investing in the stock market can result in financial loss. Historical results are no guarantee of future returns. No representation is being made that any account will or is likely to achieve profits or losses similar to those shown. Stock tips or ‘buy’ or sell recommendations are not provided. This educational information is not designed to replace your Licensed Financial Consultant or your Stockbroker. It has been prepared without regard to any particular person's investment objectives, financial situation and particular needs. This information is of a general nature only so you should seek advice from your broker or other investment advisors as appropriate before taking any action. The decision to trade and the method of trading is for the reader alone to decide. Avestra Securities Pty Ltd (Avestra) AFSL 292464, and ShareTradingEducation.com (“STE”), as Corporate Authorized Representative of Avestra, disclaims all liability of Avestra, STE and its Associates for any loss or damage suffered by any person by reason of the use by that person of, or their reliance on any information contained herein, whether arising from the negligence of Avestra, STE or its Associates or otherwise. Refer also to the full disclaimer at the back of each newsletter Edition and our Terms of Use. How to Write Your Own Stock & Futures Trading Plan Copyright© 2008 Tim Wilcox, Jim Berg, John Atkinson & Sharetradingeducation.com CHAPTER 5. 68 EXITS We deliberately discuss Exit Strategies in this chapter before we look at Entry Triggers. Why? Most inexperienced traders spend the majority of their time looking at the next trade to buy. They incorrectly assume that having put the effort into this research and then having entered the market, they can relax knowing their decision will be ‘right’. This type of thinking leads to a false bias. In contrast, experienced traders concentrate more on when they will exit: o Before they enter: They decide on an Initial Stop Loss – where they will exit if the trade goes against them o At breakeven: The Stop Loss is raised after prices move in their direction, so that an exit at this level will recover trade capital o At a profit: When their Trailing Stop Loss is triggered or their profit target met 11. Exit Strategy 11.1 Exit strategies are harder to get right than entry strategies. Unfortunately, they are much more important because, self evidently, they control the profit and loss. If you trade more than one strategy, you will need to answer these questions for each strategy employed as the signals that determine your exits may vary. Arguably, for discretionary traders, the best exit strategy is one that is dynamic and market controlled, as opposed to a rigid mechanical strategy imposed upon each trade, regardless of market conditions. The difference between the two can best be explained with an example. Suppose you have a mechanical strategy that is based upon a 3:1 risk reward ratio. So, if you risk £30.00, you will exit as soon as the trade shows a profit of £90.00 or a loss of -£30.00, whichever gets hit first. Very simple. If you have a Success ratio of 26% or more, then in time, you will make money. Not a lot, but some. Chances are that a good percentage of the losing trades will show some gains before moving against you and triggering your stop. Additionally, a handful of the winning trades will go on to achieve much larger gains than the £90.00 you took when you closed the trade using the mechanical exit. A dynamic, market controlled exit enables you to take some money off the table offered by the eventual losers and let the big winners run to realize a greater proportion of the increased gains on offer. These additional profits could transform an overall trading strategy from one that barely breaks even into one that is very profitable indeed. Disclaimer: Direct investing in the stock market can result in financial loss. Historical results are no guarantee of future returns. No representation is being made that any account will or is likely to achieve profits or losses similar to those shown. Stock tips or ‘buy’ or sell recommendations are not provided. This educational information is not designed to replace your Licensed Financial Consultant or your Stockbroker. It has been prepared without regard to any particular person's investment objectives, financial situation and particular needs. This information is of a general nature only so you should seek advice from your broker or other investment advisors as appropriate before taking any action. The decision to trade and the method of trading is for the reader alone to decide. Avestra Securities Pty Ltd (Avestra) AFSL 292464, and ShareTradingEducation.com (“STE”), as Corporate Authorized Representative of Avestra, disclaims all liability of Avestra, STE and its Associates for any loss or damage suffered by any person by reason of the use by that person of, or their reliance on any information contained herein, whether arising from the negligence of Avestra, STE or its Associates or otherwise. Refer also to the full disclaimer at the back of each newsletter Edition and our Terms of Use. How to Write Your Own Stock & Futures Trading Plan Copyright© 2008 Tim Wilcox, Jim Berg, John Atkinson & Sharetradingeducation.com 69 11.2 Losing trades - Will You Exit Before Your Stop is Hit? Some strategies always exit the trade at the point that the stop loss is triggered and not before. The advantage of this approach is that it allows you some extra ‘wiggle’ room, which may result in a profitable trade. Conversely, the downside is that your losing trades are always at the maximum allowed by your strategy and, in the event of a bad fill, may even exceed the maximum. TW: If the trade goes against me, my exit strategy permits me to . . . (close the trade early if the conditions in 11.3 below are met). JB: If the trade goes against me, I only exit when the stop is hit. 11.3 Losing trades – Which Signals Will See You Exit Early? If you opt to close the trade before your stop loss order is filled, what are the precise signals that will trigger your exit? TW: If the trade goes against me, I will exit before the stop loss order is filled . . . (if the price does not move X points in my favor by the close of the next price bar following entry). JB: If the trade goes against me, I will never exit before the stop loss order is filled. 11.4 Winning Trades – Which Signals Will See You Exit Completely? There will be times when it is advisable to get out – and fast! Be prepared for those occasions and know in advance what signals to watch out for. TW: I will close my whole position immediately . . . (upon the price crossing the XYZ moving average). JB: (Refer Questions 11.7 to 11.11 for more details) I will close my position: A) Short-term Stock Trading (daily chart) – only on: Initial Stop (exit after one day’s close below) - to protect capital or Trailing Stop (exit after two days consecutive closes below - to lock in profits or Berg Profit Taker conditions being met – to grab ‘spike’ profits when prices become overheated Disclaimer: Direct investing in the stock market can result in financial loss. Historical results are no guarantee of future returns. No representation is being made that any account will or is likely to achieve profits or losses similar to those shown. Stock tips or ‘buy’ or sell recommendations are not provided. This educational information is not designed to replace your Licensed Financial Consultant or your Stockbroker. It has been prepared without regard to any particular person's investment objectives, financial situation and particular needs. This information is of a general nature only so you should seek advice from your broker or other investment advisors as appropriate before taking any action. The decision to trade and the method of trading is for the reader alone to decide. Avestra Securities Pty Ltd (Avestra) AFSL 292464, and ShareTradingEducation.com (“STE”), as Corporate Authorized Representative of Avestra, disclaims all liability of Avestra, STE and its Associates for any loss or damage suffered by any person by reason of the use by that person of, or their reliance on any information contained herein, whether arising from the negligence of Avestra, STE or its Associates or otherwise. Refer also to the full disclaimer at the back of each newsletter Edition and our Terms of Use. How to Write Your Own Stock & Futures Trading Plan Copyright© 2008 Tim Wilcox, Jim Berg, John Atkinson & Sharetradingeducation.com 70 B) Long-term Stock Investing (weekly chart) – only on: Initial Stop or Trailing Stop i.e. The use of the Berg Profit Taker does not apply. Note that: 1. For short term trading, my Initial Stop exit is after one day’s close below. My Trailing Stop exit is after two days of consecutive closes below. In contrast, 2. For long term investing, my Initial Stop exit is after one weekly close below. My Trailing Stop exit is after two weekly consecutive closes below. 11.5 Winning Trades – Which Signals Will See You Close Half? A popular approach is to close half your position at the first target or at the first sign of weakness and let the other half run. TW: I will close half my position . . . (upon a X% increase/decrease in volume compared with the previous price bar). JB: I never close half my position. 11.6 Winning Trades – Which Signals Will See You Close the Remainder? Even if your exit strategies thus far are well planned and executed, the success of your entire strategy could still hinge on how you exit the second half of a profitable trade. TW: I will close out the second half of my position . . . (at the very end of the day, based on my research which indicates that on trending days, my instruments close within X% of the high of the day (H.O.D.)). JB: I never close half my position. 11.7 More on Jim Berg’s Exit Rules So far under this Question 11 we have discussed Exit Strategies in answer to the questions raised in Tim Wilcox’ original Trading Plan Template. Before we move on to Entry triggers, we recap and show in detail the exit strategies developed for the Trading Plan for our notional newsletter stock portfolios. These are based on Jim Berg’s Home Study Courses ‘Trading Strategies with JB Premium Charts’ (part of his JB Combo package) - or for Metastock users, his ‘Trading Strategies with Metastock’ . Disclaimer: Direct investing in the stock market can result in financial loss. Historical results are no guarantee of future returns. No representation is being made that any account will or is likely to achieve profits or losses similar to those shown. Stock tips or ‘buy’ or sell recommendations are not provided. This educational information is not designed to replace your Licensed Financial Consultant or your Stockbroker. It has been prepared without regard to any particular person's investment objectives, financial situation and particular needs. This information is of a general nature only so you should seek advice from your broker or other investment advisors as appropriate before taking any action. The decision to trade and the method of trading is for the reader alone to decide. Avestra Securities Pty Ltd (Avestra) AFSL 292464, and ShareTradingEducation.com (“STE”), as Corporate Authorized Representative of Avestra, disclaims all liability of Avestra, STE and its Associates for any loss or damage suffered by any person by reason of the use by that person of, or their reliance on any information contained herein, whether arising from the negligence of Avestra, STE or its Associates or otherwise. Refer also to the full disclaimer at the back of each newsletter Edition and our Terms of Use. How to Write Your Own Stock & Futures Trading Plan Copyright© 2008 Tim Wilcox, Jim Berg, John Atkinson & Sharetradingeducation.com 71 We expand on the ideas presented to date and illustrate them with charts. We all learn from repetition and for many of us, if we see something presented a second time (or more), our understanding increases. So we now feature a total of his two main types of stock entry & exit strategies to choose from, each with their own set of rules and explained further as follows: Short term - for grabbing short term profits as soon as they occur Long –Term - for longer term ‘buy and hold’ investors All three approaches are primarily strategies applied to trend trades and they share the same entry conditions – oversold conditions in a rising market. The main differences in approach are: The time frame as to how long we hold the stocks Use of weekly charts for Long term Investing vs daily charts for Short term Trading Using the Berg Profit Taker for Short Term Trading Management of how stop losses are applied. A second long term investing strategy employed by Jim Berg is entering after a downtrend has been completed and a new uptrend has been confirmed. Details for this are featured in Jim’s ‘Stock Trading Handbook - Fundamental and Technical Analysis Combined. Shorter term trading approaches have tighter stops, in case prices retrace, whereas the longer term has a wider stop i.e. it is further below the price action - to give the stock more room to oscillate in the longer term. The short term approaches also use the Berg Profit Taker to take profits if prices break up and close above this volatility indicator that Jim has designed. It works on the assumption that if prices extend above their usual range, then they are often likely to retrace - like being pulled back by an elastic band. This allows short term traders to grab those profits before prices pull back The following notes on Exits are based on Jim Berg’s ebook ‘The Stock Trading Handbook – Fundamental & Technical Analysis Combined’ and are provided as further explanation. 11.8 Jim Berg’s Exits: Initial Stop Loss How, and when, a trader exits the market is the tool they use to control profits and losses. Having a strategy for getting out of a losing trade is essential to becoming a successful investor. An experienced trader wants to lose the least amount of money possible when he or she has a losing trade. Disclaimer: Direct investing in the stock market can result in financial loss. Historical results are no guarantee of future returns. No representation is being made that any account will or is likely to achieve profits or losses similar to those shown. Stock tips or ‘buy’ or sell recommendations are not provided. This educational information is not designed to replace your Licensed Financial Consultant or your Stockbroker. It has been prepared without regard to any particular person's investment objectives, financial situation and particular needs. This information is of a general nature only so you should seek advice from your broker or other investment advisors as appropriate before taking any action. The decision to trade and the method of trading is for the reader alone to decide. Avestra Securities Pty Ltd (Avestra) AFSL 292464, and ShareTradingEducation.com (“STE”), as Corporate Authorized Representative of Avestra, disclaims all liability of Avestra, STE and its Associates for any loss or damage suffered by any person by reason of the use by that person of, or their reliance on any information contained herein, whether arising from the negligence of Avestra, STE or its Associates or otherwise. Refer also to the full disclaimer at the back of each newsletter Edition and our Terms of Use. How to Write Your Own Stock & Futures Trading Plan Copyright© 2008 Tim Wilcox, Jim Berg, John Atkinson & Sharetradingeducation.com 72 The first exit established is a stop-loss exit based on a worst case scenario. If an investor buys stocks in a company and the price falls, there must be a point at which the position is liquidated. This exit point is determined by simple chart analysis before the stocks are purchased. There are a number of obvious levels to place a stop-loss exit. Three of the most commonly used stop-loss exit points shown below are: o Below a recent low o Below a trend line o Below a polarized support / resistance level The following Initial Stop rules apply for my long term investing and my short term stock trading strategies. My preference is to set my Initial Stop below a significant recent low (Chart 5.1) and below any round numbers which are otherwise likely to attract buying support. I will not enter the position if there is a potential price fall from entry price to initial stop loss price of more than 10%. We call this the Trade Risk. It should not be confused with Portfolio Risk, which is the maximum % of the portfolio which we are prepared to lose in any trade (Refer Question 10.9). If the stock trade goes against me, I exit the position after one day’s close below the Initial Stop for short term stock trading or after one weekly close below for long term investing. Chart 5.1 Stop Loss Below Recent Low Disclaimer: Direct investing in the stock market can result in financial loss. Historical results are no guarantee of future returns. No representation is being made that any account will or is likely to achieve profits or losses similar to those shown. Stock tips or ‘buy’ or sell recommendations are not provided. This educational information is not designed to replace your Licensed Financial Consultant or your Stockbroker. It has been prepared without regard to any particular person's investment objectives, financial situation and particular needs. This information is of a general nature only so you should seek advice from your broker or other investment advisors as appropriate before taking any action. The decision to trade and the method of trading is for the reader alone to decide. Avestra Securities Pty Ltd (Avestra) AFSL 292464, and ShareTradingEducation.com (“STE”), as Corporate Authorized Representative of Avestra, disclaims all liability of Avestra, STE and its Associates for any loss or damage suffered by any person by reason of the use by that person of, or their reliance on any information contained herein, whether arising from the negligence of Avestra, STE or its Associates or otherwise. Refer also to the full disclaimer at the back of each newsletter Edition and our Terms of Use. How to Write Your Own Stock & Futures Trading Plan Copyright© 2008 Tim Wilcox, Jim Berg, John Atkinson & Sharetradingeducation.com 73 11.9 Jim Berg’s Exits: Trailing Stops The second exit an investor needs to calculate is the Trailing Stop. Once the market is trading in the desired direction the Initial Stop Loss is no longer needed. Yet no investor would be pleased to see a profit disappear and result in a loss. The Trailing Stop is designed to keep the investor in the position while the market is trending and to protect a significant portion of the profit if the trend is reversed. Three popular trailing stops are: ¾ Moving Average ¾ Parabolic (SAR) ¾ ATR Volatility My preference is a Volatility Trailing Stop (see Chart 5.2 on next page). The timing of when I switch from an Initial Stop to a Trailing Stop is important. There is a danger of making the switch too early and running the risk of being whipsawed out of the trade unnecessarily. I have found that, following a retracement in prices and a reversal from a significant low, my blue bar entry signal (see Chapter 6) is often generated on low volatility. Subsequently, as prices start to move back up, the volatility often increases as more buyers worry about missing out and are prepared to pay higher prices. However, sometimes a whiplash effect results when prices surge higher, then suddenly retrace again. To ensure the trade is not closed prematurely by having the stop too close during this time, I prefer to keep my Initial Stop in place until conditions settle. Accordingly, my approach is to wait to switch from the Initial Stop and apply the Trailing Stop after the next higher high. Two examples are shown in Charts 5.3 and 5.4 below. The Volatility Trailing Stop is based on the Average True Range, as defined in the Introduction as: Average True Range (ATR) - ATR measures volatility by averaging price ranges over a set time period while taking into account trading gaps. The True Range indicator is defined as the greatest of the following for each period: ¾ The distance from today's high to today's low. ¾ The distance from yesterdays close to today's high. ¾ The distance from yesterdays close to today's low. Disclaimer: Direct investing in the stock market can result in financial loss. Historical results are no guarantee of future returns. No representation is being made that any account will or is likely to achieve profits or losses similar to those shown. Stock tips or ‘buy’ or sell recommendations are not provided. This educational information is not designed to replace your Licensed Financial Consultant or your Stockbroker. It has been prepared without regard to any particular person's investment objectives, financial situation and particular needs. This information is of a general nature only so you should seek advice from your broker or other investment advisors as appropriate before taking any action. The decision to trade and the method of trading is for the reader alone to decide. Avestra Securities Pty Ltd (Avestra) AFSL 292464, and ShareTradingEducation.com (“STE”), as Corporate Authorized Representative of Avestra, disclaims all liability of Avestra, STE and its Associates for any loss or damage suffered by any person by reason of the use by that person of, or their reliance on any information contained herein, whether arising from the negligence of Avestra, STE or its Associates or otherwise. Refer also to the full disclaimer at the back of each newsletter Edition and our Terms of Use. How to Write Your Own Stock & Futures Trading Plan Copyright© 2008 Tim Wilcox, Jim Berg, John Atkinson & Sharetradingeducation.com 74 The Average True Range is the average of the true ranges over the past x periods, where x is specified by the user. The Trailing Stop indicator rises and falls with the level of volatility and higher or lower closing prices. I never want to lower the Trailing Stop, so I adjust the formula to stay at the highest level reached for a period of 15 days or weeks, depending on the chart time frame. Chart 5.2 Volatility Trailing Stop Once in place, I exit the position after two consecutive closes below the Trailing Stop. This contrasts with exiting after one close below the Initial Stop (refer 11.8 above). Summarizing my exit strategies so far, for recording purposes, the final exiting of a notional trade in our newsletter portfolios will be taken under the following triggers: ¾ ¾ For Long term stock investing o By ONE weekly close below the INITIAL Stop Loss o Or after TWO weekly consecutive closes below the TRAILING Stop Loss, with an exit taken the following Monday For Short term stock trading o By ONE day’s close below the INITIAL stop loss Disclaimer: Direct investing in the stock market can result in financial loss. Historical results are no guarantee of future returns. No representation is being made that any account will or is likely to achieve profits or losses similar to those shown. Stock tips or ‘buy’ or sell recommendations are not provided. This educational information is not designed to replace your Licensed Financial Consultant or your Stockbroker. It has been prepared without regard to any particular person's investment objectives, financial situation and particular needs. This information is of a general nature only so you should seek advice from your broker or other investment advisors as appropriate before taking any action. The decision to trade and the method of trading is for the reader alone to decide. Avestra Securities Pty Ltd (Avestra) AFSL 292464, and ShareTradingEducation.com (“STE”), as Corporate Authorized Representative of Avestra, disclaims all liability of Avestra, STE and its Associates for any loss or damage suffered by any person by reason of the use by that person of, or their reliance on any information contained herein, whether arising from the negligence of Avestra, STE or its Associates or otherwise. Refer also to the full disclaimer at the back of each newsletter Edition and our Terms of Use. How to Write Your Own Stock & Futures Trading Plan Copyright© 2008 Tim Wilcox, Jim Berg, John Atkinson & Sharetradingeducation.com 75 o Or after TWO days of consecutive closes below the TRAILING stop loss, with an exit taken the following day o Or using the Berg Profit Taker o (Refer to Questions 11.11, 11.12 and 12 for more details) 11.10 Jim Berg’s Exits: Switching from Initial to Trailing Stop In our newsletter we include a section entitled ‘Solving Your Problems’ in which readers are invited to send in their queries on trading analysis, money and risk management, personal and market trading psychology. Further to 11.9, the following is an extract from Edition 49 of our newsletter in June 2006: Question: Jim, when do you switch from the Initial Stop to the Trailing Stop? Example 1 - Tap Oil: JB: The RSI was oversold in April and blue bar volatility entry signal given on April 20th. Enter on the following day’s open no higher than the high of the signal day ($1.95) and not greater than 10% from initial stop ($1.73). The blue bar volatility entry signal occurs after a correction that is usually accompanied by low volatility. Prices often resume the rising trend with an increase in volatility that establishes a short-term high (A) followed by a retracement (B) that takes prices below the trailing stop. This is normal market ‘noise’ that would signal an exit from the position if the trailing stop was used at this time. So the initial stop is used until prices establish a clear break of the short-term high (A), which occurs at (C). Chart 5.3 Volatility Trailing Stop – Tap Oil Disclaimer: Direct investing in the stock market can result in financial loss. Historical results are no guarantee of future returns. No representation is being made that any account will or is likely to achieve profits or losses similar to those shown. Stock tips or ‘buy’ or sell recommendations are not provided. This educational information is not designed to replace your Licensed Financial Consultant or your Stockbroker. It has been prepared without regard to any particular person's investment objectives, financial situation and particular needs. This information is of a general nature only so you should seek advice from your broker or other investment advisors as appropriate before taking any action. The decision to trade and the method of trading is for the reader alone to decide. Avestra Securities Pty Ltd (Avestra) AFSL 292464, and ShareTradingEducation.com (“STE”), as Corporate Authorized Representative of Avestra, disclaims all liability of Avestra, STE and its Associates for any loss or damage suffered by any person by reason of the use by that person of, or their reliance on any information contained herein, whether arising from the negligence of Avestra, STE or its Associates or otherwise. Refer also to the full disclaimer at the back of each newsletter Edition and our Terms of Use. How to Write Your Own Stock & Futures Trading Plan Copyright© 2008 Tim Wilcox, Jim Berg, John Atkinson & Sharetradingeducation.com 76 Example 2- Stock A: RSI oversold in April and blue bar volatility entry signal on April 11th. Enter on the following day’s open no higher than the high of the signal day ($14.57) and not greater than 10% from initial stop ($13.97). The blue bar volatility entry signal occurs after a correction that is usually accompanied by low volatility. Prices often resume the rising trend with an increase in volatility that establishes a short-term high (A) followed by a retracement (B) that takes prices below the trailing stop. This is normal market ‘noise’ that would signal an exit from the position if the trailing stop was used at this time. The initial stop is used until prices establish a clear break of the short-term high (A), which occurs at (C). Q: What about the short-term high at $14.90 and retracement to $14.65 that occurred in April (see arrows)? JB: Chart 5.4 shows the price rise to $14.90 was gradual with low volatility rather than a thrust accompanied by extended ranges. Chart 5.4 Volatility Trailing Stop – Stock A Stock A Disclaimer: Direct investing in the stock market can result in financial loss. Historical results are no guarantee of future returns. No representation is being made that any account will or is likely to achieve profits or losses similar to those shown. Stock tips or ‘buy’ or sell recommendations are not provided. This educational information is not designed to replace your Licensed Financial Consultant or your Stockbroker. It has been prepared without regard to any particular person's investment objectives, financial situation and particular needs. This information is of a general nature only so you should seek advice from your broker or other investment advisors as appropriate before taking any action. The decision to trade and the method of trading is for the reader alone to decide. Avestra Securities Pty Ltd (Avestra) AFSL 292464, and ShareTradingEducation.com (“STE”), as Corporate Authorized Representative of Avestra, disclaims all liability of Avestra, STE and its Associates for any loss or damage suffered by any person by reason of the use by that person of, or their reliance on any information contained herein, whether arising from the negligence of Avestra, STE or its Associates or otherwise. Refer also to the full disclaimer at the back of each newsletter Edition and our Terms of Use. How to Write Your Own Stock & Futures Trading Plan Copyright© 2008 Tim Wilcox, Jim Berg, John Atkinson & Sharetradingeducation.com 77 11.11 Jim Berg’s Exits: Profit Taking The third exit is optional and is designed to take profits, rather than protecting a profit with a trailing stop. Taking a profit can be more difficult than taking a loss. Investors quickly learn the importance of discipline in setting a stop loss but more variables will need to be considered when taking a profit, such as trailing stops, profit targets and topping formations. Inexperienced traders, without a clear strategy, will ride a roller coaster of emotions as they add up unrealized profits and wrestle with the decision to let the profit run or cash in before a fall in price. Alternating emotions of fear and greed can become constant companions and further erode the ability to make clear decisions. There are several strategies the investor can use to decide when to exits and take profits, including: ¾ Setting Profit targets, e.g.: Percentage move in stock price or From pattern projections (e.g. ascending triangles, bullish flags etc.) ¾ At a significant overhead resistance level or top of trading channel ¾ When a short term indicator signals a short term top e.g. Dynamic Momentum Index (DMI) ¾ Using volatility Again, my preferred short term profit taking is based on volatility. The Berg Profit Taker indicator signals when the security has moved too far too fast and has created a profit taking opportunity. See Chart 5.5 below. The formula combines a moving average of the highs with ATR (10) volatility. Under our Short Term Trading Strategy, a clear close above the JB Profit Taker with at least 10% profit signals the profit taking opportunity. The position is exited on the following day’s opening price. Chart 5.5 Berg Profit Taker Disclaimer: Direct investing in the stock market can result in financial loss. Historical results are no guarantee of future returns. No representation is being made that any account will or is likely to achieve profits or losses similar to those shown. Stock tips or ‘buy’ or sell recommendations are not provided. This educational information is not designed to replace your Licensed Financial Consultant or your Stockbroker. It has been prepared without regard to any particular person's investment objectives, financial situation and particular needs. This information is of a general nature only so you should seek advice from your broker or other investment advisors as appropriate before taking any action. The decision to trade and the method of trading is for the reader alone to decide. Avestra Securities Pty Ltd (Avestra) AFSL 292464, and ShareTradingEducation.com (“STE”), as Corporate Authorized Representative of Avestra, disclaims all liability of Avestra, STE and its Associates for any loss or damage suffered by any person by reason of the use by that person of, or their reliance on any information contained herein, whether arising from the negligence of Avestra, STE or its Associates or otherwise. Refer also to the full disclaimer at the back of each newsletter Edition and our Terms of Use. How to Write Your Own Stock & Futures Trading Plan Copyright© 2008 Tim Wilcox, Jim Berg, John Atkinson & Sharetradingeducation.com 78 11.11 Jim Berg’s Exits: Using the Berg Profit Taker As a long term conservative investor, using weekly charts, I had little use for a profit taking indicator. Short term price moves were just noise. When I added a short term trading strategy I noticed prices often moved too far too fast and usually retraced the rise just as fast. The retracement often went through my trailing stop, resulting in a small gain or loss and a lost opportunity for a profit. I had to make a decision. Do I use a trailing stop, let the profits run and miss out on some short term profits? Or take short term profits and miss out on some larger moves? Traders need to make a choice. It has to be one or the other and the trader must have the discipline to follow the plan. Trading without a plan means making a decision in the middle of the trade. Murphy’s Law means prices will continue to rise if you use a profit taking indicator or fall if you ignore the profit signal and use a trailing stop. Switching back and forth between two exit strategies becomes a roller coaster of emotions and indecision with every trade. It is also a difficult decision because traders often follow a shares’ price action after closing out a position. They are looking for confirmation they made the correct decision. I have a friend who started trading, without a plan, during the dot com boom. He bought shares in a company for $.50 and sold several months later at $4.00. The share price continued to climb to $6.00. Every day he calculated what he would have made if he still owned those shares. He was unable to trade until the crash brought prices below his exit level. Every trading strategy will have losses. Positions will be closed and the price will continue to rise. Positions held will fall in price. It takes discipline to stick to the plan and not punish yourself for unsuccessful trades. So I decided to take profits, when trading short term, and not punish myself if the share price continued to rise. I already had a volatility based entry and trailing stop, so created the JB Profit Taker, a combination of moving average and average true range. In our newsletter during early 2006 we developed our Short Term Trading Strategy which takes profits once there is a close above the Berg Profit Taker, with at least 10% profit. This is explained further in 12.8. ______________________________________________________________________________ The above sections 11.7 to 11.11 contain extracts from Jim Berg’s Investing & Online Trading newsletter and his ebook ‘The Stock Trading Handbook - Fundamental & Technical Analysis Combined . The Berg Profit Taker, JB Trailing Stop and ‘blue bar’ volatility entry trigger are part of JB Premium Charts package, which in turn, is part of his complete JB Combo. For Metastock users, they are included within Jim Berg’s Metastock Volatility Charting Template. This template is available separately or as part of Jim Berg’s Home Study Course ‘Trading Strategies with Metastock’ at www.ShareTradingEducation.com. . Disclaimer: Direct investing in the stock market can result in financial loss. Historical results are no guarantee of future returns. No representation is being made that any account will or is likely to achieve profits or losses similar to those shown. Stock tips or ‘buy’ or sell recommendations are not provided. This educational information is not designed to replace your Licensed Financial Consultant or your Stockbroker. It has been prepared without regard to any particular person's investment objectives, financial situation and particular needs. This information is of a general nature only so you should seek advice from your broker or other investment advisors as appropriate before taking any action. The decision to trade and the method of trading is for the reader alone to decide. Avestra Securities Pty Ltd (Avestra) AFSL 292464, and ShareTradingEducation.com (“STE”), as Corporate Authorized Representative of Avestra, disclaims all liability of Avestra, STE and its Associates for any loss or damage suffered by any person by reason of the use by that person of, or their reliance on any information contained herein, whether arising from the negligence of Avestra, STE or its Associates or otherwise. Refer also to the full disclaimer at the back of each newsletter Edition and our Terms of Use. How to Write Your Own Stock & Futures Trading Plan Copyright© 2008 Tim Wilcox, Jim Berg, John Atkinson & Sharetradingeducation.com 79 CHAPTER 6 TRADE STRATEGIES By Tim Wilcox, Jim Berg & John Atkinson • Set Ups • Entries Disclaimer: Direct investing in the stock market can result in financial loss. Historical results are no guarantee of future returns. No representation is being made that any account will or is likely to achieve profits or losses similar to those shown. Stock tips or ‘buy’ or sell recommendations are not provided. This educational information is not designed to replace your Licensed Financial Consultant or your Stockbroker. It has been prepared without regard to any particular person's investment objectives, financial situation and particular needs. This information is of a general nature only so you should seek advice from your broker or other investment advisors as appropriate before taking any action. The decision to trade and the method of trading is for the reader alone to decide. Avestra Securities Pty Ltd (Avestra) AFSL 292464, and ShareTradingEducation.com (“STE”), as Corporate Authorized Representative of Avestra, disclaims all liability of Avestra, STE and its Associates for any loss or damage suffered by any person by reason of the use by that person of, or their reliance on any information contained herein, whether arising from the negligence of Avestra, STE or its Associates or otherwise. Refer also to the full disclaimer at the back of each newsletter Edition and our Terms of Use. How to Write Your Own Stock & Futures Trading Plan Copyright© 2008 Tim Wilcox, Jim Berg, John Atkinson & Sharetradingeducation.com 80 CHAPTER 6. TRADE STRATEGIES – Set Ups and Entries 12. Trade Strategies, Setups & Entries 12.1 Strategies vary according to market conditions, the time of day and the timeframe in which they are traded. Arguably, virtually all strategies fall into one of three generic groups: breakouts, retracements and reversals. Within these groups are individual strategies, some of which have fancy names and are well known. For example, ‘The Sonic Boom Dive’ is a retracement strategy described by Van K. Tharp in his book, ‘Financial Freedom Through Electronic Day Trading’. The vast majority, however, remain locked in the minds of the traders who created them and form part of their ‘edge’. 12.2 Which Strategies Will You Trade? Many professional traders recommend having at least two different trading strategies, one for a trending market and one for a non-trending market. Additionally, they would recommend getting just one strategy up and running – i.e. one that is tested and profitable – before attempting to introduce another. Keep it simple! TW: My primary trading strategy is designed for a non-trending market. It is a . . . (retracement strategy, trading stocks that gap up/down at the open. The premise is that the market tends to over react to news, be it good or bad, causing the price to become over extended. Subsequently, it then reverts to a more equitable level and the gap is often filled). My secondary trading strategy is designed for a trending market. It is a . . . (breakout strategy, which aims to jump on the bandwagon upon the continuation of a strong trend). JB: I trade trending markets. Rising sub industry sectors using a weekly chart and rising stocks within those sectors. 12.3 What are Your Setups? A setup is the set of characteristics that enables you to identify a high probability trade prior to your entry trigger being hit. Try and keep the components of your setups very simple, in order that you may spot them quickly in real time and assess their potential in an instant. It is imperative that your setups are very clearly defined and thoroughly tested prior to live trading in order to determine their probability of success. This cannot be over emphasized, so much so in fact, that failure to define and test your setups will largely invalidate your trading plan and render useless all your work thus far. It is one of the characteristics that separate the professional trader from the ‘shoot from the hip’ gambler. TW: The setup for my primary strategy comprises the following elements . . . (1. Opening gap is 1% - 3%. 2. The 50-day moving average must be clearly in the direction of the proposed trade. 3. The gap should be into resistance / support, but not breaching it. 4. Evidence of strong volume pre-market).The setup for my secondary strategy comprises the following elements . . . (1. Price must be in a clear up / down trend according to my definition of a trend, which is . . . XYZ. 2. Price breaks through yesterday’s high / low of the day to make a new high / low. 3. Price pulls back to yesterday’s high / low but does not breach it). Disclaimer: Direct investing in the stock market can result in financial loss. Historical results are no guarantee of future returns. No representation is being made that any account will or is likely to achieve profits or losses similar to those shown. Stock tips or ‘buy’ or sell recommendations are not provided. This educational information is not designed to replace your Licensed Financial Consultant or your Stockbroker. It has been prepared without regard to any particular person's investment objectives, financial situation and particular needs. This information is of a general nature only so you should seek advice from your broker or other investment advisors as appropriate before taking any action. The decision to trade and the method of trading is for the reader alone to decide. Avestra Securities Pty Ltd (Avestra) AFSL 292464, and ShareTradingEducation.com (“STE”), as Corporate Authorized Representative of Avestra, disclaims all liability of Avestra, STE and its Associates for any loss or damage suffered by any person by reason of the use by that person of, or their reliance on any information contained herein, whether arising from the negligence of Avestra, STE or its Associates or otherwise. Refer also to the full disclaimer at the back of each newsletter Edition and our Terms of Use. How to Write Your Own Stock & Futures Trading Plan Copyright© 2008 Tim Wilcox, Jim Berg, John Atkinson & Sharetradingeducation.com 81 JB: My overall trading strategy is to buy on temporary weakness within a rising market. This weakness and my entry conditions often occur on low volatility. The aim is to place some science to the old market saying ‘buy on weakness’. After extensive back testing, I have developed a set of structured criteria and rules, with the aim of timing the entry prior to resumption of the uptrend. My entry conditions for short term trading and long term investing are virtually identical. From then on, it is only the management of the trade which varies. For my long term investing, I first filter through potential lists of stocks to ensure they pass my fundamental analysis criteria*. I then test the shortened list(s) using technical analysis. I look for two main types of situation, either: a) Trend Reversal – i.e. The completion of a downtrend and confirmation that the uptrend is in place or a b) Strong uptrend which has become temporarily oversold, has paused and is now starting to resume its uptrend In both situations the setup for a rising sector/share on a weekly chart is: Prices are making higher highs and higher lows Prices are closing above a 34 week moving average Moving average is rising In situation a) once weekly prices close above the 34 week moving average, I enter the market on the following Monday. In situation b) I look for a: Retracement on a daily chart Temporary oversold condition using the Relative Strength Index (RSI) Prices beginning to resume their climb A ‘blue bar’ volatility entry signal using my JB Charting Template (on daily charts) My JB Charting software changes the colour of the price bars from red to blue when the market moves sufficiently from the recent low (and the opposite for red bars from the recent top). Once all my entry conditions are met, I use the blue bar as my entry signal and enter on the following day's open. Disclaimer: Direct investing in the stock market can result in financial loss. Historical results are no guarantee of future returns. No representation is being made that any account will or is likely to achieve profits or losses similar to those shown. Stock tips or ‘buy’ or sell recommendations are not provided. This educational information is not designed to replace your Licensed Financial Consultant or your Stockbroker. It has been prepared without regard to any particular person's investment objectives, financial situation and particular needs. This information is of a general nature only so you should seek advice from your broker or other investment advisors as appropriate before taking any action. The decision to trade and the method of trading is for the reader alone to decide. Avestra Securities Pty Ltd (Avestra) AFSL 292464, and ShareTradingEducation.com (“STE”), as Corporate Authorized Representative of Avestra, disclaims all liability of Avestra, STE and its Associates for any loss or damage suffered by any person by reason of the use by that person of, or their reliance on any information contained herein, whether arising from the negligence of Avestra, STE or its Associates or otherwise. Refer also to the full disclaimer at the back of each newsletter Edition and our Terms of Use. How to Write Your Own Stock & Futures Trading Plan Copyright© 2008 Tim Wilcox, Jim Berg, John Atkinson & Sharetradingeducation.com 82 For me, it is a sensible place to enter. Rising markets usually correct on lower volume & lower volatility - so my entry is close to the Initial Stop. When the market resumes its rise it usually switches back to higher volume & volatility which should benefit my position After my blue bar entry signal is generated I then enter the market, provided the price is no higher than the high of the entry trigger day. For both a) and b) I place an Initial Stop below the recent major low (see Chapter 5). I also apply strict money and risk management rules, as discussed in Chapter 4. This includes my Trade Risk rule such that the distance between the proposed/actual entry and initial stop loss price must be less than 10% of the stock price (refer 10.9 and 11.8). * Editor’s note: The subject of Fundamental Analysis is outside the scope of this Trading Plan Template and is discussed further in Jim Berg’s ‘Stock Trading Handbook – Fundamental Analysis Combined ‘. 12.4 How Will You Find Your Setups? If your trading is confined to one or two instruments, this is easy! However, if you trade stocks listed on the Nasdaq or NYSE, for example, then you will probably need to scan everything listed on the exchange in order to find the setups that you require. TW: I will find the setups that I require by . . . (utilizing the bespoke stock scanning software from ClerverClogs.com. The criteria for each scan is defined by the characteristics of the setups for each trading strategy). JB: I find suitable trading opportunities by searching using two strategies: 1)Scroll through sub industry sector charts to determine which are in a rising trend. Fundamental Analysis: Use MarketScan software to filter stocks in that sector to find healthy, low risk companies that meet specific fundamental criteria. Determine which remaining shares meet my set-up criteria. 2) Scroll through my main watch-lists of shares – Monopolies, Take over targets & Expert’s Picks 12.5 Which Signals Will Trigger Your Entry? Clear, precise and succinct statements characterize a good trading plan. In answering this question, it is vital that there is no room left for ambiguity. In other words, if 100 traders read your answers to this question, would they all try to enter your trades at the same time and at the same price? This is a tough goal to achieve, but aim for it nonetheless. Disclaimer: Direct investing in the stock market can result in financial loss. Historical results are no guarantee of future returns. No representation is being made that any account will or is likely to achieve profits or losses similar to those shown. Stock tips or ‘buy’ or sell recommendations are not provided. This educational information is not designed to replace your Licensed Financial Consultant or your Stockbroker. It has been prepared without regard to any particular person's investment objectives, financial situation and particular needs. This information is of a general nature only so you should seek advice from your broker or other investment advisors as appropriate before taking any action. The decision to trade and the method of trading is for the reader alone to decide. Avestra Securities Pty Ltd (Avestra) AFSL 292464, and ShareTradingEducation.com (“STE”), as Corporate Authorized Representative of Avestra, disclaims all liability of Avestra, STE and its Associates for any loss or damage suffered by any person by reason of the use by that person of, or their reliance on any information contained herein, whether arising from the negligence of Avestra, STE or its Associates or otherwise. Refer also to the full disclaimer at the back of each newsletter Edition and our Terms of Use. How to Write Your Own Stock & Futures Trading Plan Copyright© 2008 Tim Wilcox, Jim Berg, John Atkinson & Sharetradingeducation.com 83 TW: The entry trigger for my primary strategy is . . . (to go long upon breach of the open on a 5 minute chart providing the open is the high of the day (H.O.D.). Reverse for a short trade). The entry trigger for my secondary strategy is . . . (to go long when the stock resumes the direction of the trend and hits yesterday’s high on a 10 minute chart. Reverse for a short trade). JB: In 12.3 I explained my definitions for a rising sector/stock, on a weekly chart: Prices are making higher highs and higher lows Prices are closing above a 34 week moving average Moving average is rising The weekly chart of the Diversified Financials Industry Group sector (below) met the above criteria at that time. Chart 6.1 Setups – Diversfied Financials The Australian Stock Exchange (ASX), and Sydney Futures Exchange (SFE) were members of the Diversified Financials Industry Group sector then (Figures 6.2 and 6.3 below). The weekly charts of both companies (below) also met the setup criteria at that time. Chart 6.2 Setups – ASX weekly Disclaimer: Direct investing in the stock market can result in financial loss. Historical results are no guarantee of future returns. No representation is being made that any account will or is likely to achieve profits or losses similar to those shown. Stock tips or ‘buy’ or sell recommendations are not provided. This educational information is not designed to replace your Licensed Financial Consultant or your Stockbroker. It has been prepared without regard to any particular person's investment objectives, financial situation and particular needs. This information is of a general nature only so you should seek advice from your broker or other investment advisors as appropriate before taking any action. The decision to trade and the method of trading is for the reader alone to decide. Avestra Securities Pty Ltd (Avestra) AFSL 292464, and ShareTradingEducation.com (“STE”), as Corporate Authorized Representative of Avestra, disclaims all liability of Avestra, STE and its Associates for any loss or damage suffered by any person by reason of the use by that person of, or their reliance on any information contained herein, whether arising from the negligence of Avestra, STE or its Associates or otherwise. Refer also to the full disclaimer at the back of each newsletter Edition and our Terms of Use. How to Write Your Own Stock & Futures Trading Plan Copyright© 2008 Tim Wilcox, Jim Berg, John Atkinson & Sharetradingeducation.com 84 Chart 6.3 Setups – SFE weekly I then look for a retracement on a daily chart and temporary oversold condition using the Relative Strength Index (RSI) Figure 6.4 below is a daily chart of ASX that appeared in our newsletter Edition 18 as a potential notional trade. A retracement and RSI(7) oversold condition occurred in October. Chart 6.4 Setups – ASX daily Disclaimer: Direct investing in the stock market can result in financial loss. Historical results are no guarantee of future returns. No representation is being made that any account will or is likely to achieve profits or losses similar to those shown. Stock tips or ‘buy’ or sell recommendations are not provided. This educational information is not designed to replace your Licensed Financial Consultant or your Stockbroker. It has been prepared without regard to any particular person's investment objectives, financial situation and particular needs. This information is of a general nature only so you should seek advice from your broker or other investment advisors as appropriate before taking any action. The decision to trade and the method of trading is for the reader alone to decide. Avestra Securities Pty Ltd (Avestra) AFSL 292464, and ShareTradingEducation.com (“STE”), as Corporate Authorized Representative of Avestra, disclaims all liability of Avestra, STE and its Associates for any loss or damage suffered by any person by reason of the use by that person of, or their reliance on any information contained herein, whether arising from the negligence of Avestra, STE or its Associates or otherwise. Refer also to the full disclaimer at the back of each newsletter Edition and our Terms of Use. How to Write Your Own Stock & Futures Trading Plan Copyright© 2008 Tim Wilcox, Jim Berg, John Atkinson & Sharetradingeducation.com 85 The daily SFE chart, Figure 6.5 below, also appeared in newsletter Edition 18 as a potential notional trade. Again, a retracement and RSI(7) oversold condition occurred in October. Chart 6.5 Setups – SFE daily My entry trigger is based on volatility. My JB Premium Charts and, for Metastock users, my JB Volatility Charting Template use Average True Range (ATR) as part of their calculations. I enter when price bars change from red to blue i.e. the closing price changes provides a blue bar volatility entry signal in a rising uptrend and after the RSI has given the alert. The ASX chart, Figure 6.6 below shows a blue bar volatility entry on October 18th. Chart 6.6 Entry – ASX daily Disclaimer: Direct investing in the stock market can result in financial loss. Historical results are no guarantee of future returns. No representation is being made that any account will or is likely to achieve profits or losses similar to those shown. Stock tips or ‘buy’ or sell recommendations are not provided. This educational information is not designed to replace your Licensed Financial Consultant or your Stockbroker. It has been prepared without regard to any particular person's investment objectives, financial situation and particular needs. This information is of a general nature only so you should seek advice from your broker or other investment advisors as appropriate before taking any action. The decision to trade and the method of trading is for the reader alone to decide. Avestra Securities Pty Ltd (Avestra) AFSL 292464, and ShareTradingEducation.com (“STE”), as Corporate Authorized Representative of Avestra, disclaims all liability of Avestra, STE and its Associates for any loss or damage suffered by any person by reason of the use by that person of, or their reliance on any information contained herein, whether arising from the negligence of Avestra, STE or its Associates or otherwise. Refer also to the full disclaimer at the back of each newsletter Edition and our Terms of Use. How to Write Your Own Stock & Futures Trading Plan Copyright© 2008 Tim Wilcox, Jim Berg, John Atkinson & Sharetradingeducation.com 86 The SFE chart, Figure 6.7 below shows a blue bar volatility entry on October 26th. Chart 6.7 Entry – SFE daily ______________________________________________________________________________ The Berg Profit Taker, JB Trailing Stop and ‘blue bar’ volatility entry trigger are part of JB Premium Charts package, which in turn, is part of his complete JB Combo. For Metastock users, they are included within Jim Berg’s Metastock Volatility Charting Template. This template is available separately or as part of Jim Berg’s Home Study Course ‘Trading Strategies with Metastock’ at www.ShareTradingEducation.com. Disclaimer: Direct investing in the stock market can result in financial loss. Historical results are no guarantee of future returns. No representation is being made that any account will or is likely to achieve profits or losses similar to those shown. Stock tips or ‘buy’ or sell recommendations are not provided. This educational information is not designed to replace your Licensed Financial Consultant or your Stockbroker. It has been prepared without regard to any particular person's investment objectives, financial situation and particular needs. This information is of a general nature only so you should seek advice from your broker or other investment advisors as appropriate before taking any action. The decision to trade and the method of trading is for the reader alone to decide. Avestra Securities Pty Ltd (Avestra) AFSL 292464, and ShareTradingEducation.com (“STE”), as Corporate Authorized Representative of Avestra, disclaims all liability of Avestra, STE and its Associates for any loss or damage suffered by any person by reason of the use by that person of, or their reliance on any information contained herein, whether arising from the negligence of Avestra, STE or its Associates or otherwise. Refer also to the full disclaimer at the back of each newsletter Edition and our Terms of Use. How to Write Your Own Stock & Futures Trading Plan Copyright© 2008 Tim Wilcox, Jim Berg, John Atkinson & Sharetradingeducation.com 87 CHAPTER 7 MORE ON JIM BERG’S INVESTING & TRADING STRATEGIES By Jim Berg and John Atkinson • JB Short Term Portfolio • JB Short Term Portfolio Position Sizing • JB Short Term Trading Rules • Summary of Jim Berg’s Strategies • Money & Risk Management Summary Disclaimer: Direct investing in the stock market can result in financial loss. Historical results are no guarantee of future returns. No representation is being made that any account will or is likely to achieve profits or losses similar to those shown. Stock tips or ‘buy’ or sell recommendations are not provided. This educational information is not designed to replace your Licensed Financial Consultant or your Stockbroker. It has been prepared without regard to any particular person's investment objectives, financial situation and particular needs. This information is of a general nature only so you should seek advice from your broker or other investment advisors as appropriate before taking any action. The decision to trade and the method of trading is for the reader alone to decide. Avestra Securities Pty Ltd (Avestra) AFSL 292464, and ShareTradingEducation.com (“STE”), as Corporate Authorized Representative of Avestra, disclaims all liability of Avestra, STE and its Associates for any loss or damage suffered by any person by reason of the use by that person of, or their reliance on any information contained herein, whether arising from the negligence of Avestra, STE or its Associates or otherwise. Refer also to the full disclaimer at the back of each newsletter Edition and our Terms of Use. How to Write Your Own Stock & Futures Trading Plan Copyright© 2008 Tim Wilcox, Jim Berg, John Atkinson & Sharetradingeducation.com 88 JB: The following sections 12.6 and 12.7 are based on extracts from Edition 28 of our Investing & Online Trading newsletter in January 2006. It covers my Short term Strategy rules and money management considerations for multiple short term stock positions. It is provided here to show some of the thought processes which went into the initial Trading Plan. Please note: Question 12.11 then provides an update as of July 2006. 12.6 Jim Berg’s Short Term Trading Portfolio The Short Term trading rules were developed especially for this newsletter. We originally started using the same shares which had been selected for the long term investing Portfolio to demonstrate how some traders grab short term profits. During the lead up to the October 05 correction, this approach provided better results than the buy and hold strategy. However, this may not necessarily always be the case. For example, over the past few years there have been some significant long term profits available by investing in many fundamentally sound companies in strong uptrends. Having developed the Short Term rules, we then showed how they could be applied to a number of other shares. Table 7.1 Short Term Volatility Entries For a selection of 15 shares, Table 7.1 shows an average gross return of 10.9% in 37 days - for 14 of the bundle of 15 stocks chosen. The remaining share gave an entry signal which would have required purchasing on the day the signal was generated, in which case a profit of 10.5% would also have been achieved in 23 days. Disclaimer: Direct investing in the stock market can result in financial loss. Historical results are no guarantee of future returns. No representation is being made that any account will or is likely to achieve profits or losses similar to those shown. Stock tips or ‘buy’ or sell recommendations are not provided. This educational information is not designed to replace your Licensed Financial Consultant or your Stockbroker. It has been prepared without regard to any particular person's investment objectives, financial situation and particular needs. This information is of a general nature only so you should seek advice from your broker or other investment advisors as appropriate before taking any action. The decision to trade and the method of trading is for the reader alone to decide. Avestra Securities Pty Ltd (Avestra) AFSL 292464, and ShareTradingEducation.com (“STE”), as Corporate Authorized Representative of Avestra, disclaims all liability of Avestra, STE and its Associates for any loss or damage suffered by any person by reason of the use by that person of, or their reliance on any information contained herein, whether arising from the negligence of Avestra, STE or its Associates or otherwise. Refer also to the full disclaimer at the back of each newsletter Edition and our Terms of Use. How to Write Your Own Stock & Futures Trading Plan Copyright© 2008 Tim Wilcox, Jim Berg, John Atkinson & Sharetradingeducation.com 89 A 100% win-loss success rate is unusual and we must not expect to repeat this again as past experience is no guarantee of future performance. We report on the newsletter short term trading notional portfolio performance each week - as well as the more conservative notional Long term Investing Portfolio from time to time. We structure the Portfolio as below: Notional initial portfolio value $100k Max trade loss: 10% Max portfolio risk per trade 1% (‘shark attack’) Max total portfolio risk: 6% (‘piranha attack’) Max in any one position 15% of total portfolio Max in any one sector: 30% The main differences for the Short Term Trading Portfolio are as follows: The use of watchlists of companies recommended by analysts/brokers. We plan to hold up to 9 positions at any time. We discuss the reasoning below For simplicity we will adopt a standard notional trade size of $9.5k per trade (again see below). This will save us from having to repeat explanations on how we calculate position size each week, particularly as we expect to be turning over each of the notional trades within an estimated 1-6 weeks, subject to entry and exit signals being generated. Trade selection criteria using Jim Berg’s Short Term Trading Rules repeated below. 12.7 Short Term Trading Portfolio Position Sizing: The following notes are provided as extracts from our diary notes, discussions and emails between Jim and John in early 2006 as we planned the structure for the Short Term portfolio. They show the thought processes we went through. We start with the need to consider brokerage as this would be a real cost to consider, particularly with frequent short term trades. John and Angela trade on the Etrade platform so we will use this as an example for our notional portfolio. Their rates are about AU$20-$30 +GST per transaction, depending on trading frequency. For simplicity, we will assume total return brokerage on buying and selling will be an average of say, $60 including GST. Disclaimer: Direct investing in the stock market can result in financial loss. Historical results are no guarantee of future returns. No representation is being made that any account will or is likely to achieve profits or losses similar to those shown. Stock tips or ‘buy’ or sell recommendations are not provided. This educational information is not designed to replace your Licensed Financial Consultant or your Stockbroker. It has been prepared without regard to any particular person's investment objectives, financial situation and particular needs. This information is of a general nature only so you should seek advice from your broker or other investment advisors as appropriate before taking any action. The decision to trade and the method of trading is for the reader alone to decide. Avestra Securities Pty Ltd (Avestra) AFSL 292464, and ShareTradingEducation.com (“STE”), as Corporate Authorized Representative of Avestra, disclaims all liability of Avestra, STE and its Associates for any loss or damage suffered by any person by reason of the use by that person of, or their reliance on any information contained herein, whether arising from the negligence of Avestra, STE or its Associates or otherwise. Refer also to the full disclaimer at the back of each newsletter Edition and our Terms of Use. How to Write Your Own Stock & Futures Trading Plan Copyright© 2008 Tim Wilcox, Jim Berg, John Atkinson & Sharetradingeducation.com 90 To provide maximum interest to our readers, we wanted to include as many shares in the notional portfolio as possible. Immediately we ran into a challenge. We call this the ‘kid in the lolly shop syndrome’. It’s a mistake too many novices make, wanting to invest in as many stocks as possible to ‘spread their risk’ and be in anything that ‘moves’. While we also do not advocate doing the opposite extreme i.e ‘having all your eggs in one basket ’ by sinking all funds into one position - there is a better approach, as we will now explain. a) Let’s Test 15 Notional Positions Let’s suppose we were to have chosen a total of 15 positions in the portfolio. Apart from the increased workload in monitoring so many positions each night, the calculations to come up with a constant position size do not fare well, as shown below: ¾ If we had divided our notional $100k equally into 15 – that would have allowed us $6,667 gross i.e. $6,607 net after return brokerage per trade, say $6500. ¾ Above we stated that our maximum Trade Risk is planned to be 10%. Many may be in the order of 5%. Let’s say on average 7% trade risk. ¾ Then each notional trade on average would put at risk $6,500 x 7% + return brokerage = $515. Each position would be risking 0.52% of our total portfolio, so this fits well within our 1% maximum ‘shark attack’ rule. ¾ However 15 positions each risking $515 = a total initial risk of $7,725 i.e. 7.7%. This fails our 6% max ‘piranha attack’ rule. ¾ We would need to scale back to satisfy this limiting criterion of total combined portfolio risk of 6% to only $400 risk per trade on average. This means we would need to reduce individual notional position sizes to $4,850. The corresponding individual portfolio risk would each then be 7% x $4.85k + return brokerage = $400 i.e. 0.4%. ¾ But wait - there’s more! By having so many positions, not only would we have reduced our position size down to only $4,850, but we would have also brought in 2 other complications: We would have had 15 x $4,850k positions = $72.8k (excl bro) , with ~ 27% still in cash If the notional short term trades were to make 10% profit, then 10% of $4,850 = $485 gross, out of which return brokerage of $60 would have absorbed $60/$485 i.e. 12.4% of the gross profit per trade to brokerage The idea of 15 notional positions was therefore discarded quite quickly. b) 8 Notional Positions Many experienced traders/investors adopt a maximum of about 8 to 12 shares in their portfolio. Disclaimer: Direct investing in the stock market can result in financial loss. Historical results are no guarantee of future returns. No representation is being made that any account will or is likely to achieve profits or losses similar to those shown. Stock tips or ‘buy’ or sell recommendations are not provided. This educational information is not designed to replace your Licensed Financial Consultant or your Stockbroker. It has been prepared without regard to any particular person's investment objectives, financial situation and particular needs. This information is of a general nature only so you should seek advice from your broker or other investment advisors as appropriate before taking any action. The decision to trade and the method of trading is for the reader alone to decide. Avestra Securities Pty Ltd (Avestra) AFSL 292464, and ShareTradingEducation.com (“STE”), as Corporate Authorized Representative of Avestra, disclaims all liability of Avestra, STE and its Associates for any loss or damage suffered by any person by reason of the use by that person of, or their reliance on any information contained herein, whether arising from the negligence of Avestra, STE or its Associates or otherwise. Refer also to the full disclaimer at the back of each newsletter Edition and our Terms of Use. How to Write Your Own Stock & Futures Trading Plan Copyright© 2008 Tim Wilcox, Jim Berg, John Atkinson & Sharetradingeducation.com 91 For simplicity, to save repeating the calculations for various alternatives we considered, we will go straight to the conclusion. For the Short term Portfolio, we will use the following constant position sizing model in future: Maximum 8 positions Each position $9,500k For a maximum 10% trade risk and an average trade risk of, say 7%: Av. Individual trade risk = 7% x $9.5k + $60 bro = $725 = 0.73% i.e. <1%of $100k portfolio so passes our 1% rule Total portfolio risk = $725 x 8 positions = $5,800 = 5.8% i.e. <6% of $100k portfolio ie passes our 6% rule Total 8 x $9.5k +bro = ~$76.2k i.e. $23.8k in cash If notional short term trades were to make 10% profit, then 10% of $9,500 = $950 gross each i.e. return brokerage of $60 would have absorbed 60/950 i.e. 6.3% of the gross profit per notional trade to brokerage. 12.8 Short Term Trading Rules For completeness, we repeat the Short Term rules developed for the ‘Investing & Online Trading’ newsletter as follows: Short-Term: Rising trend on weekly chart RSI(7) oversold (daily) Volatility Entry (daily) Initial Stop – below the recent low (max 10% from entry) Trailing Stop – 2nd consecutive close below stop Berg Profit Taker (minimum 10%) Close above Profit Taker - exit following day’s open Or Exit with 15% Profit Two examples using Short Term rules: Disclaimer: Direct investing in the stock market can result in financial loss. Historical results are no guarantee of future returns. No representation is being made that any account will or is likely to achieve profits or losses similar to those shown. Stock tips or ‘buy’ or sell recommendations are not provided. This educational information is not designed to replace your Licensed Financial Consultant or your Stockbroker. It has been prepared without regard to any particular person's investment objectives, financial situation and particular needs. This information is of a general nature only so you should seek advice from your broker or other investment advisors as appropriate before taking any action. The decision to trade and the method of trading is for the reader alone to decide. Avestra Securities Pty Ltd (Avestra) AFSL 292464, and ShareTradingEducation.com (“STE”), as Corporate Authorized Representative of Avestra, disclaims all liability of Avestra, STE and its Associates for any loss or damage suffered by any person by reason of the use by that person of, or their reliance on any information contained herein, whether arising from the negligence of Avestra, STE or its Associates or otherwise. Refer also to the full disclaimer at the back of each newsletter Edition and our Terms of Use. How to Write Your Own Stock & Futures Trading Plan Copyright© 2008 Tim Wilcox, Jim Berg, John Atkinson & Sharetradingeducation.com a) 92 BRAMBLES (BIL) had an RSI (7) temporary oversold condition in October and a blue bar volatility entry on October 26th. Entry on the following day’s open at $8.48 and Initial stop set below the recent low at $7.97 (Chart 7.1) Chart 7.1 Short Term Trading (1) - BIL Exit with profit on November 29th at $9.76. Result: + 15% b) Suncorp-Metway (SUN) had an RSI (7) temporary oversold condition in December and a blue bar volatility entry on December 21st. Entry on the following day’s open at $19.92 and initial stop below the recent low at $19.27 (Chart 7.2). Chart 7.2 Short Term Trading (1) - SUN Price closed above JB Profit Taker on January 27th. Close position on following day’s open at $21.91. Result: +10% Disclaimer: Direct investing in the stock market can result in financial loss. Historical results are no guarantee of future returns. No representation is being made that any account will or is likely to achieve profits or losses similar to those shown. Stock tips or ‘buy’ or sell recommendations are not provided. This educational information is not designed to replace your Licensed Financial Consultant or your Stockbroker. It has been prepared without regard to any particular person's investment objectives, financial situation and particular needs. This information is of a general nature only so you should seek advice from your broker or other investment advisors as appropriate before taking any action. The decision to trade and the method of trading is for the reader alone to decide. Avestra Securities Pty Ltd (Avestra) AFSL 292464, and ShareTradingEducation.com (“STE”), as Corporate Authorized Representative of Avestra, disclaims all liability of Avestra, STE and its Associates for any loss or damage suffered by any person by reason of the use by that person of, or their reliance on any information contained herein, whether arising from the negligence of Avestra, STE or its Associates or otherwise. Refer also to the full disclaimer at the back of each newsletter Edition and our Terms of Use. 93 How to Write Your Own Stock & Futures Trading Plan Copyright© 2008 Tim Wilcox, Jim Berg, John Atkinson & Sharetradingeducation.com 12.10 Summary of Jim Berg’s Investing & Trading Strategies In this ebook, Jim Berg has responded to Tim Wilcox’ questions based on his two investing strategies. Before we close this chapter, we now bring together three of Jim Berg’s strategies, in the following summary shown overleaf as Table 7.2. It is important to realize that the starting point for entry remains virtually the same for all 3 strategies. The money and risk management rules of 10.13 are also simplified for the short term trading portfolio, as described in 12.7 above. Table 7.2 Summary of Jim Berg’s Investing & Trading Strategies Long term Investing Trend Reversal Oversold in (A) rising trend (B) Fundamental Analysis Set Up Conditions • Refer Jim Berg’s ‘Stock Trading Handbook’ ¾ Sector & Share • Trade with trend of weekly chart (34 week moving average) • Moving average rising • Close > moving average Timing of Entry Monday opening Stops: • Initial stop Recent low (pivot point) Support/resistance level Exit after one week’s close below Volatility Trailing Stop (weekly) (After second consecutive weekly close below trailing stop) (max 10% below entry) • Trailing stop Short Term Trading As for (A) As for (A) ¾ Sector & Share • Trade with trend of weekly chart (34 week moving average) • RSI(7) oversold (daily) • Volatility Entry Signal (blue bar) As for (B) • Enter at no higher than high of trigger day As for (A) • As for (B) As for (A) except exit after one day’s close below As for (A) Volatility Trailing Stop (daily) ( After 2nd consecutive daily close below trailing stop) Profit Taking N/A – exit governed by stop loss conditions As for (A) If Close above JB Profit Taker (@ min 10%) then exit after following day’s open OR exit when 15% Return $$ Management – Position Sizing Refer Chapter 4 As for (A) Refer 12.7 Disclaimer: Direct investing in the stock market can result in financial loss. Historical results are no guarantee of future returns. No representation is being made that any account will or is likely to achieve profits or losses similar to those shown. Stock tips or ‘buy’ or sell recommendations are not provided. This educational information is not designed to replace your Licensed Financial Consultant or your Stockbroker. It has been prepared without regard to any particular person's investment objectives, financial situation and particular needs. This information is of a general nature only so you should seek advice from your broker or other investment advisors as appropriate before taking any action. The decision to trade and the method of trading is for the reader alone to decide. Avestra Securities Pty Ltd (Avestra) AFSL 292464, and ShareTradingEducation.com (“STE”), as Corporate Authorized Representative of Avestra, disclaims all liability of Avestra, STE and its Associates for any loss or damage suffered by any person by reason of the use by that person of, or their reliance on any information contained herein, whether arising from the negligence of Avestra, STE or its Associates or otherwise. Refer also to the full disclaimer at the back of each newsletter Edition and our Terms of Use. How to Write Your Own Stock & Futures Trading Plan Copyright© 2008 Tim Wilcox, Jim Berg, John Atkinson & Sharetradingeducation.com 94 12.11 Jim Berg’s Money and Risk Management Update and Summary In Chapter 4 we discussed various methods for controlling money and risk management including portfolio allocation and trade optimization. We showed how this has been applied and enhanced since the early days of our single notional newsletter portfolio, which originally covered both long term investing and short term trading. In Question12.7 we showed the thought processes in how we structured the money and risk management in the dedicated notional short term trading portfolio, which we started in early 2006. The following updates are current as of March 2008 and may be amended at a later date in the newsletter if warranted. a) Long Term Investing Notional Portfolio In the early days of our ‘Investing and Online Trading’ newsletter we showed a notional long term portfolio, with stock selection and management criteria similar to those which Jim uses for his own long term self managed Superannuation /retirement fund. As many of the notional trades progressed slowly in their up trends, there was not much to report from one week to the next. Accordingly, we chose to show a short term trading portfolio rather as this allowed us to feature more stocks in a shorter time frame. We could then better demonstrate Jim’s strategies on how he selects which stocks to buy, when to buy and when to sell. Jim’s entry criteria are virtually identical for short term trading and long term investing, so from time to time we now feature the progress of a notional long term portfolio, with shares selected from the short term portfolio but then managed using weekly charts and weekly stops. As one share is exited, we then choose a replacement from the next share selected at that time for the short term portfolio Jim Berg’s fundamental analysis scan described in his ebook ‘The Stock Trading Handbook – Fundamental and Technical Analysis Combined’ is designed to target the largest cap stocks in a sub industry sector which satisfy his fundamental analysis criteria. (It is made available for newsletter members in their library).The resultant list is then filtered further using Jim’s technical analysis strategies detailed above to find the handful of large caps stocks which meet both his fundamental and technical analysis criteria at any point of time. If we were to structure the notional long term portfolio with 60% large caps, 28% mid caps and 12% small caps as per Question 10.13, then we would find that once the 60% large caps component had been filled that we would have the majority of the remaining 40% of portfolio vacant for much of the time. Therefore for the long term portfolio since July 2006 we have ignored the allocation split of large/medium/small caps. In preference we have included those stocks which match Jim’s fundamental and technical criteria, regardless of their size. However, we do apply the Aspect Financial Risk Ranking detailed in 10.13 such that we will only include those stocks with Aspect Risk Ranking of 1, 2 or 3 and omit any of 4 or 5. This rule helps ensure we do not include companies with above average Risk. Disclaimer: Direct investing in the stock market can result in financial loss. Historical results are no guarantee of future returns. No representation is being made that any account will or is likely to achieve profits or losses similar to those shown. Stock tips or ‘buy’ or sell recommendations are not provided. This educational information is not designed to replace your Licensed Financial Consultant or your Stockbroker. It has been prepared without regard to any particular person's investment objectives, financial situation and particular needs. This information is of a general nature only so you should seek advice from your broker or other investment advisors as appropriate before taking any action. The decision to trade and the method of trading is for the reader alone to decide. Avestra Securities Pty Ltd (Avestra) AFSL 292464, and ShareTradingEducation.com (“STE”), as Corporate Authorized Representative of Avestra, disclaims all liability of Avestra, STE and its Associates for any loss or damage suffered by any person by reason of the use by that person of, or their reliance on any information contained herein, whether arising from the negligence of Avestra, STE or its Associates or otherwise. Refer also to the full disclaimer at the back of each newsletter Edition and our Terms of Use. How to Write Your Own Stock & Futures Trading Plan Copyright© 2008 Tim Wilcox, Jim Berg, John Atkinson & Sharetradingeducation.com 95 In addition we incorporate the following money and risk management rules described in Chapter 4: i) Max 10% Trade Risk – between planned entry point and Initial Stop Loss ii) Maximum of 15% of portfolio allocated to any position iii) Maximum of 1% of portfolio at risk in any individual notional trades iv) 6% total combined risk of all notional trades – portfolio to be closed if it drops 6% from a recent high v) 30% sector risk b) Short Term Trading Notional Portfolio Most short term traders tend to focus on small and midcap stocks as they are more volatile - and that is what most look for in a short term system. Inexperienced traders in particular need to pay attention to apportioning and balancing their portfolio within market capitalization. Otherwise they could finish up with a portfolio of ‘pocket rockets’. While these are potentially attractive while the market is positive, they also have the potential to demolish unsuspecting traders’ accounts very quickly when the market turns down. So, to ensure common sense is maintained, we introduced the following Money and Risk Management Rules for the short term trading notional portfolio progressively since July 2006: 1) Maximum 8 stocks at any time 2) At least 4 stocks in ASX100 3) No more than 4 stocks outside the ASX100 at any time 4) Rules i) to v) as per Long Term Investing notional portfolio. For example, the 10% Trade Risk Rule will keep us out of highly speculative ‘penny dreadfuls’ which can move both ways that amount within minutes 5) No Position size to be larger than 10% of average volume over the last 5 days. For easy reference, Metastock users can simplify the analysis by creating an indicator to overlay on their charts of volume display - The formula is Mov(V,5,S) We have spent a lot of time discussing Money and Risk Management in this ebook. This is because we believe that this skill when coupled with strong discipline are just as, if not more than, important than the stocks you buy. Many traders load up on the latest software and as many indicators as they can find in an attempt to improve their trading results. There is an easier way. Master the topic of Money and Risk Management and you will find you can improve your returns ……. without necessarily having to win more trades. ______________________________________________________________________________ Further examples on using Jim Berg’s long term investing and short term trading strategies are covered in his ‘Stock Trading Handbook’ (part of his complete JB Combo Package, & Home Study Course for Metastock users ) and his mentoring style ‘Investing & Online Trading’ newsletter. Disclaimer: Direct investing in the stock market can result in financial loss. Historical results are no guarantee of future returns. No representation is being made that any account will or is likely to achieve profits or losses similar to those shown. Stock tips or ‘buy’ or sell recommendations are not provided. This educational information is not designed to replace your Licensed Financial Consultant or your Stockbroker. It has been prepared without regard to any particular person's investment objectives, financial situation and particular needs. This information is of a general nature only so you should seek advice from your broker or other investment advisors as appropriate before taking any action. The decision to trade and the method of trading is for the reader alone to decide. Avestra Securities Pty Ltd (Avestra) AFSL 292464, and ShareTradingEducation.com (“STE”), as Corporate Authorized Representative of Avestra, disclaims all liability of Avestra, STE and its Associates for any loss or damage suffered by any person by reason of the use by that person of, or their reliance on any information contained herein, whether arising from the negligence of Avestra, STE or its Associates or otherwise. Refer also to the full disclaimer at the back of each newsletter Edition and our Terms of Use. How to Write Your Own Stock & Futures Trading Plan Copyright© 2008 Tim Wilcox, Jim Berg, John Atkinson & Sharetradingeducation.com 96 CHAPTER 8 RECORD KEEPING & DISCIPLINE By Tim Wilcox, Jim Berg & John Atkinson • After The Market Closes • Discipline Disclaimer: Direct investing in the stock market can result in financial loss. Historical results are no guarantee of future returns. No representation is being made that any account will or is likely to achieve profits or losses similar to those shown. Stock tips or ‘buy’ or sell recommendations are not provided. This educational information is not designed to replace your Licensed Financial Consultant or your Stockbroker. It has been prepared without regard to any particular person's investment objectives, financial situation and particular needs. This information is of a general nature only so you should seek advice from your broker or other investment advisors as appropriate before taking any action. The decision to trade and the method of trading is for the reader alone to decide. Avestra Securities Pty Ltd (Avestra) AFSL 292464, and ShareTradingEducation.com (“STE”), as Corporate Authorized Representative of Avestra, disclaims all liability of Avestra, STE and its Associates for any loss or damage suffered by any person by reason of the use by that person of, or their reliance on any information contained herein, whether arising from the negligence of Avestra, STE or its Associates or otherwise. Refer also to the full disclaimer at the back of each newsletter Edition and our Terms of Use. How to Write Your Own Stock & Futures Trading Plan Copyright© 2008 Tim Wilcox, Jim Berg, John Atkinson & Sharetradingeducation.com CHAPTER 8. 97 Record Keeping & Discipline 13. After the Market Closes 13.1 Once you have finished trading for the day, it is tempting to crack open a bottle either to celebrate or to drown your sorrows! Your trading plan may or may not allow for these activities. Either way, it must include examining both winning and losing trades. It is essential that you know what you did right and, more importantly, what you did wrong. 13.2 Have You Recorded Today’s Trades? Recording all your trades is a must and is something all professional traders do routinely and comprehensively. Details to write down include: entries, exits, stops, targets, support and resistance levels, open / close, high / low of day, duration of trades and key lessons learnt. TW: After the market closes, I will . . . (1. examine each trade and write down the following details . XYZ. 2. Annotate a chart and back up same on C.D. for future reference). JB: After the market closes I: ¾ ¾ ¾ Record all new entries and exits Enter/delete charts from portfolio layout Download the day’s data In his book ‘Come into my Trading Room’ Dr Alexander Elder wrote: “Keeping good records is the single most important contribution to your success. If you maintain scrupulous records, review them and learn from them, your performance will improve. If your money management is in place to ensure survival during the learning process, you’re sure to be a success……..Records are more important to your success than any indicator, system or technical tool. Even the best system is bound to have some holes, but good records will allow you to find them and plug them up……….Show me a trader with good records and I’ll show you a good trader.” There are many Portfolio Management programs available. Some are simplistic, such as those provided free by most online brokers, which mainly show your current positions and open profits. Various account keeping packages, such as Microsoft Money and Quicken are available for purchase. At our site we also feature purpose-built money and risk management software packages by Stator-AFM and JBL Risk Manager in Australia and ManusRisco in USA , with free trials available for both. Disclaimer: Direct investing in the stock market can result in financial loss. Historical results are no guarantee of future returns. No representation is being made that any account will or is likely to achieve profits or losses similar to those shown. Stock tips or ‘buy’ or sell recommendations are not provided. This educational information is not designed to replace your Licensed Financial Consultant or your Stockbroker. It has been prepared without regard to any particular person's investment objectives, financial situation and particular needs. This information is of a general nature only so you should seek advice from your broker or other investment advisors as appropriate before taking any action. The decision to trade and the method of trading is for the reader alone to decide. Avestra Securities Pty Ltd (Avestra) AFSL 292464, and ShareTradingEducation.com (“STE”), as Corporate Authorized Representative of Avestra, disclaims all liability of Avestra, STE and its Associates for any loss or damage suffered by any person by reason of the use by that person of, or their reliance on any information contained herein, whether arising from the negligence of Avestra, STE or its Associates or otherwise. Refer also to the full disclaimer at the back of each newsletter Edition and our Terms of Use. How to Write Your Own Stock & Futures Trading Plan Copyright© 2008 Tim Wilcox, Jim Berg, John Atkinson & Sharetradingeducation.com 98 13.3 Did You Execute Your Trades According to Your Plan? It is tempting to gloss over this question. Don’t! If you are not routinely executing trades in accordance with the plan, then you either have a serious problem with self-discipline or there is a problem with your plan. Either way, you have a BIG problem and one that needs to be addressed immediately. TW: In addition to recording all my trades, I check to . . . (confirm that all trades are executed in accordance with my plan. If they are not, I will assess if the reason is a fault with the plan itself or a discipline issue and take action accordingly) JB: All trades are executed according to the plan 13.4 Have You Completed Your Trading Journal? Trading and emotions are like oil and water. Or at least they should be! Your trading plan is designed to ensure that you trade unemotionally. If you struggle with this, then consider a mechanical strategy. Your trading journal is the one place where you can vent your emotions and express your feelings. TW: I regularly update my trading journal with . . . (my thoughts and feelings about each trade and my conclusions about the day as a whole). JB: My trading is mechanical so I do not need to record my feelings at the end of the day. I put a lot of thought into creating and testing my system. In the middle of a trade I don’t think about what I am doing, I react to price movements by following the rules. 14. Discipline! 14.1 Having a comprehensive trading plan with detailed entry and exit criteria and excellent risk and money management procedures all count for nothing if you lack the necessary discipline to implement them. This section is about ensuring that you stick rigidly to the commitments that you have made to YOURSELF in the previous nine units. Adhering to your plan is relatively easy during periods of profit. However, the real test will be your ability to stick to it when your trading is not going so well. 14.2 Back Test or Forward Test? Before you commence live trading, it is important to test your trading strategy. If you are a mechanical trader, this can be done mathematically with programs like TradeStation and, even, MS Excel. If you are a discretionary trader, manually back-test it if at all possible and then ‘forward-test’ by paper trading your strategy. Whilst paper trading will not reflect how you will trade in real time, it will indicate whether or not your basic strategy is unprofitable or, hopefully, a potential goldmine. Disclaimer: Direct investing in the stock market can result in financial loss. Historical results are no guarantee of future returns. No representation is being made that any account will or is likely to achieve profits or losses similar to those shown. Stock tips or ‘buy’ or sell recommendations are not provided. This educational information is not designed to replace your Licensed Financial Consultant or your Stockbroker. It has been prepared without regard to any particular person's investment objectives, financial situation and particular needs. This information is of a general nature only so you should seek advice from your broker or other investment advisors as appropriate before taking any action. The decision to trade and the method of trading is for the reader alone to decide. Avestra Securities Pty Ltd (Avestra) AFSL 292464, and ShareTradingEducation.com (“STE”), as Corporate Authorized Representative of Avestra, disclaims all liability of Avestra, STE and its Associates for any loss or damage suffered by any person by reason of the use by that person of, or their reliance on any information contained herein, whether arising from the negligence of Avestra, STE or its Associates or otherwise. Refer also to the full disclaimer at the back of each newsletter Edition and our Terms of Use. How to Write Your Own Stock & Futures Trading Plan Copyright© 2008 Tim Wilcox, Jim Berg, John Atkinson & Sharetradingeducation.com 99 TW: Before I commence ‘live’ trading with real money, I will . . . (back test and/or forward test my strategies to ensure that they are tradable and meet my profit objectives without exceeding my risk and money management parameters). JB: I thoroughly back-test on two years of data manually and further test in real time. 14.3 What are Your Promises to Yourself? These are promises that are designed to enforce self-discipline. What sanctions will you impose upon yourself if you break one of your trading rules? Worse still, what about if you break two in a row? TW: If I break one of the rules detailed in my trading plan I will . . . (stop trading for a full day and focus on the reasons why there was a breach of discipline). If I break two of the rules detailed in my trading plan I will . . . (stop trading for two full days and focus on the reasons why there was a breach of discipline). If I break three of the rules detailed in my trading plan I will . . . (stop trading indefinitely until I address the reason for my poor discipline and, if necessary, amend the trading plan). JB: I promise to follow the rules and I don’t break them ever. Food for thought: a post by PeterM at the Stockmeetingplace.com forum suggested designing a poster with Discipline in big red letters across the centre, surrounded by home truths/phrases of wisdom such as: It is quite common to have a string of losing trades Losing trades are simply a by-product of the business of trading Always follow your trading rules - not just this one time Always action the stop loss Always act in your best interest A person with good self discipline but poor trading method will outperform a person with poor self discipline using the best trading method available 14.4 What Questions do You Ask After a Winning Trade? After a winning trade, there are some questions that need to be answered before moving on to the next trade. Did you do everything right; was the trade well planned and executed? Although it was profitable, could you have extracted more profit whilst adhering to your exit strategy? Your next Disclaimer: Direct investing in the stock market can result in financial loss. Historical results are no guarantee of future returns. No representation is being made that any account will or is likely to achieve profits or losses similar to those shown. Stock tips or ‘buy’ or sell recommendations are not provided. This educational information is not designed to replace your Licensed Financial Consultant or your Stockbroker. It has been prepared without regard to any particular person's investment objectives, financial situation and particular needs. This information is of a general nature only so you should seek advice from your broker or other investment advisors as appropriate before taking any action. The decision to trade and the method of trading is for the reader alone to decide. Avestra Securities Pty Ltd (Avestra) AFSL 292464, and ShareTradingEducation.com (“STE”), as Corporate Authorized Representative of Avestra, disclaims all liability of Avestra, STE and its Associates for any loss or damage suffered by any person by reason of the use by that person of, or their reliance on any information contained herein, whether arising from the negligence of Avestra, STE or its Associates or otherwise. Refer also to the full disclaimer at the back of each newsletter Edition and our Terms of Use. How to Write Your Own Stock & Futures Trading Plan Copyright© 2008 Tim Wilcox, Jim Berg, John Atkinson & Sharetradingeducation.com 100 trade could be a dud: are you sufficiently calm and relaxed to continue trading or should you take a break? TW: After a winning trade I will . . . (1. guard against over confidence and ensure that my attitude remains consistent. 2. check to see that I did everything as well as I could. 3. remind myself that executing the trade in accordance with my plan is more important than the outcome of the trade). JB: After a winning trade I record the results and check that all rules were followed. 14.5 What Questions do You Ask After a Losing Trade? Repeat the process above after a losing trade. It is acceptable, desirable even, to regard a losing trade as a successful trade – IF (and it is a big if) - you adhered to your plan. You know that you will have losing trades; all traders have them. There is no reason to lose confidence as long as you manage the losses and keep them small. Are you ready to continue trading in a calm and relaxed way or are you now subconsciously chasing the loss? TW: After a losing trade I will . . . (1. examine the trade and learn what I can from it. 2. check to ensure that I executed all aspects of the trade in accordance with my plan. 3. evaluate my state of mind to ensure that I am calm, relaxed and ready to enter the market again with an unemotional and professional attitude). JB: After a losing trade I record the results and check that all rules were followed. 14.6 What Steps do You Take to Learn More About Trading? Practical experience is, of course, essential. However, it would be wise to complement this with learning and studying. The trick here is to plan a course of study to ensure that your valuable time is spent in a focused way and advances your knowledge as quickly as possible. Trading is such a huge subject that one way or another, it is inevitable that you will read, watch and listen to a mere fraction of the information available. It is vital to ensure your precious time is concentrated on the ‘right’ material. TW: I will ensure that of the X hours per week devoted to trading . . . (Y hours are spent studying the subject. Of this time, I will devote A hours to reading books, B hours on T2W and C hours on other media). JB: My continuing education is through the media, books, weekly research for our newsletter, by John Atkinson and I and reading other newsletters occasionally. I also communicate with other students of the markets to exchange ideas and get a different perspective on trading strategies. I freely share my knowledge with other readers of our newsletter in our ‘Solving Your Trading Problems’ section of our newsletter and answering traders’ questions on one forum only, that being the unique ‘Ask Jim Berg’ section at www. ShareScene.com. We conclude this chapter with the following extract from Edition 11 of our Newsletter: Disclaimer: Direct investing in the stock market can result in financial loss. Historical results are no guarantee of future returns. No representation is being made that any account will or is likely to achieve profits or losses similar to those shown. Stock tips or ‘buy’ or sell recommendations are not provided. This educational information is not designed to replace your Licensed Financial Consultant or your Stockbroker. It has been prepared without regard to any particular person's investment objectives, financial situation and particular needs. This information is of a general nature only so you should seek advice from your broker or other investment advisors as appropriate before taking any action. The decision to trade and the method of trading is for the reader alone to decide. Avestra Securities Pty Ltd (Avestra) AFSL 292464, and ShareTradingEducation.com (“STE”), as Corporate Authorized Representative of Avestra, disclaims all liability of Avestra, STE and its Associates for any loss or damage suffered by any person by reason of the use by that person of, or their reliance on any information contained herein, whether arising from the negligence of Avestra, STE or its Associates or otherwise. Refer also to the full disclaimer at the back of each newsletter Edition and our Terms of Use. How to Write Your Own Stock & Futures Trading Plan Copyright© 2008 Tim Wilcox, Jim Berg, John Atkinson & Sharetradingeducation.com 101 The Power of Discipline Self discipline is not something you acquire. It is something you use. When you make use of it, self discipline will help to bring about anything you can imagine. And it is yours to use whenever you choose. You don't need to take a certain course or read a particular book or attend a weekend workshop in order to benefit from self discipline. The benefits of self discipline come, not with any special knowledge or skill, but with simple practice. When you decide to discipline yourself to achieve, you achieve. When you decide to make consistent use of discipline in your life, you're able to fulfill the best of your possibilities. Put self discipline to use, and you can reach your dreams. Put self discipline to use, and no obstacle can stand in your way for long. The power of self discipline is yours to use when you have a reason that's meaningful enough to you. So find that reason, lock your focus onto it, and you're already well on your way. Ralph Marston Copyright 2006 Ralph S. Marston, Jr. Used by permission. Originally published in "The Daily Motivator" at www.dailymotivator.com Disclaimer: Direct investing in the stock market can result in financial loss. Historical results are no guarantee of future returns. No representation is being made that any account will or is likely to achieve profits or losses similar to those shown. Stock tips or ‘buy’ or sell recommendations are not provided. This educational information is not designed to replace your Licensed Financial Consultant or your Stockbroker. It has been prepared without regard to any particular person's investment objectives, financial situation and particular needs. This information is of a general nature only so you should seek advice from your broker or other investment advisors as appropriate before taking any action. The decision to trade and the method of trading is for the reader alone to decide. Avestra Securities Pty Ltd (Avestra) AFSL 292464, and ShareTradingEducation.com (“STE”), as Corporate Authorized Representative of Avestra, disclaims all liability of Avestra, STE and its Associates for any loss or damage suffered by any person by reason of the use by that person of, or their reliance on any information contained herein, whether arising from the negligence of Avestra, STE or its Associates or otherwise. Refer also to the full disclaimer at the back of each newsletter Edition and our Terms of Use. How to Write Your Own Stock & Futures Trading Plan Copyright© 2008 Tim Wilcox, Jim Berg, John Atkinson & Sharetradingeducation.com 102 CHAPTER 9 20 GOLDEN RULES By Tim Wilcox, Jim Berg & John Atkinson • Golden Trading Rules • Tim Wilcox’ Top 10 Golden Rules • Jim Berg’s Top 10 Golden Rules Disclaimer: Direct investing in the stock market can result in financial loss. Historical results are no guarantee of future returns. No representation is being made that any account will or is likely to achieve profits or losses similar to those shown. Stock tips or ‘buy’ or sell recommendations are not provided. This educational information is not designed to replace your Licensed Financial Consultant or your Stockbroker. It has been prepared without regard to any particular person's investment objectives, financial situation and particular needs. This information is of a general nature only so you should seek advice from your broker or other investment advisors as appropriate before taking any action. The decision to trade and the method of trading is for the reader alone to decide. Avestra Securities Pty Ltd (Avestra) AFSL 292464, and ShareTradingEducation.com (“STE”), as Corporate Authorized Representative of Avestra, disclaims all liability of Avestra, STE and its Associates for any loss or damage suffered by any person by reason of the use by that person of, or their reliance on any information contained herein, whether arising from the negligence of Avestra, STE or its Associates or otherwise. Refer also to the full disclaimer at the back of each newsletter Edition and our Terms of Use. How to Write Your Own Stock & Futures Trading Plan Copyright© 2008 Tim Wilcox, Jim Berg, John Atkinson & Sharetradingeducation.com 103 CHAPTER 9 20 GOLDEN RULES – Two Common Perspectives from across the Globe 15. Golden Trading Rules Tim Wilcox is primarily a very short term trader in England in the Northern Hemisphere. In contrast, Jim Berg lives not far from the southern tip of Australia in the Southern Hemisphere. He prefers a conservative longer term investing approach, with some short term trading of a small part of his portfolio as ‘sport’. Two traders living almost poles apart, yet they independently have developed a list of 10 Golden Trading rules which are similar as we now see. 15.1 What are Your Top Ten Golden Trading Rules? Your rules should be ones that are pertinent and meaningful to you. Here is a list to get you thinking. Some of your rules may be on it, others not. For example, one which is omitted here but is likely to feature on many lists is: “Trade With The Trend: No Trend, No Trade!” It is an excellent rule, unless you are a trader whose main strategy is to fade the intraday trend or trade a longerterm retracement. For this section we will list Tim Wilcox’ 10 Golden Rules, then follow with Jim Berg’s – two independent traders trading different markets and time frames and physically located on opposite ends of the world (Tim is in UK and Jim is Australia)- yet you will see their 10 Golden Rules have common ground. TIM WILCOX’ 10 GOLDEN RULES # 1. PROTECT & PRESERVE YOUR CAPITAL! Inexperienced traders enter the markets focused on how much money they stand to make. Professional traders do the exact opposite; they focus on how much money they stand to lose and how they will ensure that any loss is kept to an absolute minimum. Follow the lead from the professionals: protect and preserve your capital. #2. ALWAYS SET A STOP LOSS. ALWAYS! One way to help achieve rule No.1 is to set a stop loss. If practicable, do this before opening a new position. Never rely on a mental stop loss. This is the sole preserve of a rare breed of trader: one who is very experienced and consistently profitable. Disclaimer: Direct investing in the stock market can result in financial loss. Historical results are no guarantee of future returns. No representation is being made that any account will or is likely to achieve profits or losses similar to those shown. Stock tips or ‘buy’ or sell recommendations are not provided. This educational information is not designed to replace your Licensed Financial Consultant or your Stockbroker. It has been prepared without regard to any particular person's investment objectives, financial situation and particular needs. This information is of a general nature only so you should seek advice from your broker or other investment advisors as appropriate before taking any action. The decision to trade and the method of trading is for the reader alone to decide. Avestra Securities Pty Ltd (Avestra) AFSL 292464, and ShareTradingEducation.com (“STE”), as Corporate Authorized Representative of Avestra, disclaims all liability of Avestra, STE and its Associates for any loss or damage suffered by any person by reason of the use by that person of, or their reliance on any information contained herein, whether arising from the negligence of Avestra, STE or its Associates or otherwise. Refer also to the full disclaimer at the back of each newsletter Edition and our Terms of Use. How to Write Your Own Stock & Futures Trading Plan Copyright© 2008 Tim Wilcox, Jim Berg, John Atkinson & Sharetradingeducation.com 104 The stop loss lies at the heart of all risk management strategies and is absolutely vital to ensure that you ‘cut your losses short’. So, no arguments: always set a stop loss. #3. CUT THE LOSSES SHORT – LET THE PROFITS RUN! Cutting the losses short is achieved by always having a stop loss! Additionally, continually ask yourself this question: ‘had I not entered this trade when I did, would I want to be in it now’? If the answer is no, then exit immediately. You do not have to wait for your stop to be triggered before exiting a trade! Letting the profits run is down to money management and an excellent exit strategy. Fine-tune these elements of your plan to cut the losses short and let the profits run. #4. TRADE WHAT YOU SEE – NOT WHAT YOU THINK! Egos and trading do not mix. The little voice inside your head that tells you what the market is going to do next needs to be gagged whilst trading. Whilst you are listening to him / her, you are not paying attention to what the market is revealing to you. Focus on your charts, your indicators if you use them and the price action. Look at this information and trade what you see, not what you think. #5. NEVER CHASE YOUR LOSSES. EVER! After a losing trade it is imperative that the emotions are kept at bay. This can be hard to do, especially if it is a silly error that led to the loss. When you re-enter the market, you will be trading for revenge. If you chase your losses, determined to recover them, the consequences are likely to be disastrous. Almost inevitably, this results in more losses, more emotions and so on. So, never chase your losses. Ever! #6. NEVER AVERAGE DOWN. EVER! This follows on from rule No. 5. Commit both these ‘sins’ and you run the very real risk of a blowup. The compiler of this document decided to put this theory to the test and lost 70% of his account on just one trade lasting 24 hours. Averaging down is a tactic deployed by long term buy and hold investors and should never be practiced by traders. If the trade goes against you, get out fast. Never average down. #7. KEEP EXCELLENT RECORDS! Strategically, it is essential to keep records of all your trades. Not just the profit and loss, but also the reasons why you did what you did when you did. Additionally, many traders keep a journal to record how they felt about each trade. Records act as your personal GPS device and enable you to determine how well you are sticking to your plan. #8. MAINTAIN DISCIPLINE! Keeping excellent records will also enable you to see at a glance just how disciplined you are in your trading. Failure to address issues of self-discipline will, almost certainly, be reflected in your trading performance. If you fail consistently in this regard, you have two options: Disclaimer: Direct investing in the stock market can result in financial loss. Historical results are no guarantee of future returns. No representation is being made that any account will or is likely to achieve profits or losses similar to those shown. Stock tips or ‘buy’ or sell recommendations are not provided. This educational information is not designed to replace your Licensed Financial Consultant or your Stockbroker. It has been prepared without regard to any particular person's investment objectives, financial situation and particular needs. This information is of a general nature only so you should seek advice from your broker or other investment advisors as appropriate before taking any action. The decision to trade and the method of trading is for the reader alone to decide. Avestra Securities Pty Ltd (Avestra) AFSL 292464, and ShareTradingEducation.com (“STE”), as Corporate Authorized Representative of Avestra, disclaims all liability of Avestra, STE and its Associates for any loss or damage suffered by any person by reason of the use by that person of, or their reliance on any information contained herein, whether arising from the negligence of Avestra, STE or its Associates or otherwise. Refer also to the full disclaimer at the back of each newsletter Edition and our Terms of Use. How to Write Your Own Stock & Futures Trading Plan Copyright© 2008 Tim Wilcox, Jim Berg, John Atkinson & Sharetradingeducation.com 105 1. Consider switching to a mechanical strategy, as computers have an exemplary track record when it comes to discipline. 2. Give up trading – it is not for you. #9. KEEP IT SIMPLE! Many top professionals use disarmingly simple strategies that are executed with the bare minimum of indicators. Their focus is to maintain their self-discipline and to trade according to their plan. Make it easy on yourself and keep everything as simple as possible. #10. PLAN THE TRADE – TRADE THE PLAN! Trading is not gambling; it is a business. However, the trader who enters the markets without a well conceived detailed and thoroughly tested trading plan is no better off than the punter who throws darts at a board blindfolded in order to determine which horse to back. JIM BERG’s 10 GOLDEN RULES #1. SET MEASURABLE GOALS - and continuously visualize yourself reaching those goals. Every choice you make has consequences. It is your CHOICES that determine the RESULTS you get. Take responsibility for your own life. Don’t blame other people or circumstances for where you are or how you got there Monitor and measure your performance regularly. Just before you hit one goal, start to set the next one - so you always have something to shoot for. Reward yourself along the way – it creates a positive reinforcement cycle. Never be afraid to succeed. Set high goals, believe in yourself, get motivated and achieve them. Disclaimer: Direct investing in the stock market can result in financial loss. Historical results are no guarantee of future returns. No representation is being made that any account will or is likely to achieve profits or losses similar to those shown. Stock tips or ‘buy’ or sell recommendations are not provided. This educational information is not designed to replace your Licensed Financial Consultant or your Stockbroker. It has been prepared without regard to any particular person's investment objectives, financial situation and particular needs. This information is of a general nature only so you should seek advice from your broker or other investment advisors as appropriate before taking any action. The decision to trade and the method of trading is for the reader alone to decide. Avestra Securities Pty Ltd (Avestra) AFSL 292464, and ShareTradingEducation.com (“STE”), as Corporate Authorized Representative of Avestra, disclaims all liability of Avestra, STE and its Associates for any loss or damage suffered by any person by reason of the use by that person of, or their reliance on any information contained herein, whether arising from the negligence of Avestra, STE or its Associates or otherwise. Refer also to the full disclaimer at the back of each newsletter Edition and our Terms of Use. How to Write Your Own Stock & Futures Trading Plan Copyright© 2008 Tim Wilcox, Jim Berg, John Atkinson & Sharetradingeducation.com 106 #2. DEVELOP & ADHERE TO A WRITTEN TRADING PLAN There is a well worn cliché “If you fail to plan then you’re planning to fail”. Unfortunately for far too many traders and investors, this is very true. We cannot emphasise strongly enough the importance of having a Trading Plan which, at the very minimum, should list how an investor will: Evaluate market conditions Choose investing and trading strategies Select which share, fund, index etc to buy Detail methods for: • Entry and exit conditions • Money and risk management, including Position Sizing • Stop Loss calculations • Protecting profits • Setting profit targets Trading Plans must be written down, kept in a prominent position and most importantly, followed with discipline. #3. LIMIT POSITION SIZE & NUMBER OF POSITIONS Take the time to plan and calculate your individual position size risk and your total portfolio risk before entering any new trade (e.g. using the Atkinson Portfolio Planner & Trade Optimizer). Use the 2% Risk Rule (or 1% or 0.5% whichever you choose) to protect yourself against a ‘shark attack’ in any trade Use the 6% Risk Rule to protect against a ‘piranha attack’ of being stripped to the bone. Make sure that you can actually live with the risk you have calculated i.e. that if your stop is triggered at that level, you will actually exit without flinching or freezing. If not, reduce the position size to be within your ‘flinch zone’ #4. PROTECT CAPITAL to SURVIVE - PROTECT PROFITS to THRIVE The first goal of money management is survival. Disclaimer: Direct investing in the stock market can result in financial loss. Historical results are no guarantee of future returns. No representation is being made that any account will or is likely to achieve profits or losses similar to those shown. Stock tips or ‘buy’ or sell recommendations are not provided. This educational information is not designed to replace your Licensed Financial Consultant or your Stockbroker. It has been prepared without regard to any particular person's investment objectives, financial situation and particular needs. This information is of a general nature only so you should seek advice from your broker or other investment advisors as appropriate before taking any action. The decision to trade and the method of trading is for the reader alone to decide. Avestra Securities Pty Ltd (Avestra) AFSL 292464, and ShareTradingEducation.com (“STE”), as Corporate Authorized Representative of Avestra, disclaims all liability of Avestra, STE and its Associates for any loss or damage suffered by any person by reason of the use by that person of, or their reliance on any information contained herein, whether arising from the negligence of Avestra, STE or its Associates or otherwise. Refer also to the full disclaimer at the back of each newsletter Edition and our Terms of Use. How to Write Your Own Stock & Futures Trading Plan Copyright© 2008 Tim Wilcox, Jim Berg, John Atkinson & Sharetradingeducation.com 107 Risk control is an important key to success. Successful traders learn that losses are a part of doing business. No one succeeds at trading without being wrong many times. It is how quickly losses are taken, and their magnitude, which is important. Trade for steady gains and small draw-downs to establish a good track record Investing is a business. The goal of the successful trader is to trade well. Successful traders have realistic expectations. Money will be a by-product of conducting business successfully. #5. SELL YOUR WORST PERFORMING POSITION Never limit your thinking on how much you can make - but limit very closely the amount you can lose. If you suffer a series of losses, reduce your exposure, always selling losing positions and holding winning positions until they provide an exit signal. If a new potential trade comes to your attention but you don’t have funds available, do not impulsively cut out of a trade that’s performing well to access funds for the next trade. Some traders have a rule to ensure they sell their worst performing positions rather than their best performing. This way they always keep the strongest horses in their stable. #6. TRADE WITH WEIGHT-OF-EVIDENCE Weight-of-evidence means a Company meets a number of fundamental and technical criteria before inclusion in a portfolio. Create your own list of fundamental and technical criteria, then ensure that “…all the planets are aligned..” i.e. that they are all met before entering the market. Resist the urge to make exceptions “just this once”, as this leads to undisciplined trading. #7. SELF AWARENESS IS THE KEY The successful trader is patient. Knowing when not to trade is often as important as when to trade. The successful trader does not get attached to their trades or a particular group of shares, but remains unbiased and diversified Choose a trading timeframe that suits your personality and philosophy of trading. This will ensure that your trading fits comfortably with your daily activities, family and lifestyle. #8. WALK A MILE WITH THE CROWD THEN STEP BACK This is a quote from Daryl Guppy’s ‘Share Trading’ book. Successful traders think independently. They do not follow the crowd. Disclaimer: Direct investing in the stock market can result in financial loss. Historical results are no guarantee of future returns. No representation is being made that any account will or is likely to achieve profits or losses similar to those shown. Stock tips or ‘buy’ or sell recommendations are not provided. This educational information is not designed to replace your Licensed Financial Consultant or your Stockbroker. It has been prepared without regard to any particular person's investment objectives, financial situation and particular needs. This information is of a general nature only so you should seek advice from your broker or other investment advisors as appropriate before taking any action. The decision to trade and the method of trading is for the reader alone to decide. Avestra Securities Pty Ltd (Avestra) AFSL 292464, and ShareTradingEducation.com (“STE”), as Corporate Authorized Representative of Avestra, disclaims all liability of Avestra, STE and its Associates for any loss or damage suffered by any person by reason of the use by that person of, or their reliance on any information contained herein, whether arising from the negligence of Avestra, STE or its Associates or otherwise. Refer also to the full disclaimer at the back of each newsletter Edition and our Terms of Use. How to Write Your Own Stock & Futures Trading Plan Copyright© 2008 Tim Wilcox, Jim Berg, John Atkinson & Sharetradingeducation.com 108 Successful traders do not fight the trend. Good money is made well off the lows and before the highs. Predicting tops and bottoms is the road to ruin. Wait for confirmation that the stock price is moving in your direction. Then when your entry signal is generated, hitch a ride with the crowd. When you’re satisfied with your profit or when your exit signal is generated, exit and look for the next trade. #9. RESPECT YOUR ANALYSIS - and take action. One of the easiest ways to develop a trading strategy is to “borrow” a system from another trader. The borrowed system is used as a base to test and eventually build a trading strategy that suits the investor’s personality and trading philosophy. It is extremely important that the investor feels confident their trading system suits them and they believe their investment strategies will make money. Gaining this confidence and belief is accomplished by testing the trading system on both historical and real time data Having chosen a proven trading system to ‘borrow’ which matches your personality and lifestyle, it is important not to trade with real funds until you feel comfortable that you have back tested it and are confident that you can trade the system profitably. The way to do this is to paper trade without using real money. Do all your analysis; trade selection; set initial stops; calculate position size; place your hypothetical buy & sell orders; keep a trading diary; monitor your positions; move up your trailing stops; enter your records – all as if you are trading the market for real - but do it on paper only. Eventually there comes a time to trade with real money. If the system you have borrowed or developed and tested is profitable then respect your analysis and take action – enter and exit with your calculated position sizes; monitor your performance and keep accurate records for review. #10. DISCIPLINE, DISCIPLINE, DISCIPLINE The following is a quote from one of the classic books on trading discipline, The Disciplined Trader, by Mark Douglas. It is republished here with his permission and our thanks: “Execute your losing trades immediately upon the perception that they exist. When losses are predefined and executed without hesitation, there is nothing to consider, weigh or judge and consequently nothing to tempt yourself with. There will be no threat of allowing yourself the possibility of ultimate disaster. Disclaimer: Direct investing in the stock market can result in financial loss. Historical results are no guarantee of future returns. No representation is being made that any account will or is likely to achieve profits or losses similar to those shown. Stock tips or ‘buy’ or sell recommendations are not provided. This educational information is not designed to replace your Licensed Financial Consultant or your Stockbroker. It has been prepared without regard to any particular person's investment objectives, financial situation and particular needs. This information is of a general nature only so you should seek advice from your broker or other investment advisors as appropriate before taking any action. The decision to trade and the method of trading is for the reader alone to decide. Avestra Securities Pty Ltd (Avestra) AFSL 292464, and ShareTradingEducation.com (“STE”), as Corporate Authorized Representative of Avestra, disclaims all liability of Avestra, STE and its Associates for any loss or damage suffered by any person by reason of the use by that person of, or their reliance on any information contained herein, whether arising from the negligence of Avestra, STE or its Associates or otherwise. Refer also to the full disclaimer at the back of each newsletter Edition and our Terms of Use. How to Write Your Own Stock & Futures Trading Plan Copyright© 2008 Tim Wilcox, Jim Berg, John Atkinson & Sharetradingeducation.com 109 If you find yourself considering, weighing or judging, then you are either not predefining what a loss is or you are not executing them immediately, in which case if you don’t and it turns out to be profitable, you are reinforcing an inappropriate behaviour that will inevitably lead to disaster. Or if you don’t and the loss worsens, you will create a negative cycle of pain that once started will be difficult to stop.” Mark Douglas. No one knows where markets are going. Successful investors react to price movements. They are not forecasting, but working with the probability of historical price action repeating itself in the next timeframe. They have a specialised trading strategy and the discipline to follow the plan. We thank Dr Brett Steenbarger again for writing the foreword to this ebook and again now for concluding this chapter with an excerpt from an article in our newsletter entitled ‘Trading by Rules – a Psychological Perspective’: “It is common to hear traders assert that mental self-control is the key to stock market and futures profits. This article is suggesting that the reverse is equally true: Staying grounded in solid trading rules and systems is one of the most powerful ways of maintaining a positive trading psychology. When we are rule-governed, we are in a mental state that promotes efficient perception, problem solving, and action. Indeed, training ourselves to stay rule governed during trading rehearsals is an effective strategy for cultivating rule governance in real time. Different rule systems may work better for different traders, depending on time frames and markets traded. My own rules make considerable use of such statistics as the NYSE TICK, the number of stocks advancing vs. declining on an intraday basis, and the number of stocks making new intraday highs and lows. Such rules would be poorly suited to the trading of agricultural commodities, but have proven useful in trading intraday swings of the equity indexes. Other rules, such as pure price-based breakout methods, possess wider application across markets and might allow for the holding of positions for longer time frames to maximize potential gains. Ultimately, the rules/systems you follow—and their linkage into coherent trading plans—must be well suited to your personality, including your risk-tolerance. Researching the performance of your system—discovering its weaknesses and strengths—and trading them with small initial positions is of immense help in building your trading confidence and ensuring that the rules work for you. If we believe many of the “Wizard” traders interviewed by Jack Schwager, then a key to trading success is surviving one’s own learning curve. Identifying the system(s) that work for you, translating them into consistent trading strategies, and learning to be comfortable with these is an important part of that process.” ______________________________________________________________________________ Brett Steenbarger Ph.D. (www.brettsteenbarger.com) is Associate Clinical Professor of Psychiatry and Behavioral Sciences at SUNY Upstate Medical University in Syracuse, NY and author of The Psychology of Trading (Wiley, 2003) and ‘Enhancing Trader Performance’ (Wily 2007).. Disclaimer: Direct investing in the stock market can result in financial loss. Historical results are no guarantee of future returns. No representation is being made that any account will or is likely to achieve profits or losses similar to those shown. Stock tips or ‘buy’ or sell recommendations are not provided. This educational information is not designed to replace your Licensed Financial Consultant or your Stockbroker. It has been prepared without regard to any particular person's investment objectives, financial situation and particular needs. This information is of a general nature only so you should seek advice from your broker or other investment advisors as appropriate before taking any action. The decision to trade and the method of trading is for the reader alone to decide. Avestra Securities Pty Ltd (Avestra) AFSL 292464, and ShareTradingEducation.com (“STE”), as Corporate Authorized Representative of Avestra, disclaims all liability of Avestra, STE and its Associates for any loss or damage suffered by any person by reason of the use by that person of, or their reliance on any information contained herein, whether arising from the negligence of Avestra, STE or its Associates or otherwise. Refer also to the full disclaimer at the back of each newsletter Edition and our Terms of Use. How to Write Your Own Stock & Futures Trading Plan Copyright© 2008 Tim Wilcox, Jim Berg, John Atkinson & Sharetradingeducation.com 110 CHAPTER 10 TRADING PLAN TEMPLATE SUMMARY & CONCLUSION By Tim Wilcox, Jim Berg and John Atkinson • Tim and Jim’s Wrap Up • Trading Plan Template Summary • Bibliography • Glossary Disclaimer: Direct investing in the stock market can result in financial loss. Historical results are no guarantee of future returns. No representation is being made that any account will or is likely to achieve profits or losses similar to those shown. Stock tips or ‘buy’ or sell recommendations are not provided. This educational information is not designed to replace your Licensed Financial Consultant or your Stockbroker. It has been prepared without regard to any particular person's investment objectives, financial situation and particular needs. This information is of a general nature only so you should seek advice from your broker or other investment advisors as appropriate before taking any action. The decision to trade and the method of trading is for the reader alone to decide. Avestra Securities Pty Ltd (Avestra) AFSL 292464, and ShareTradingEducation.com (“STE”), as Corporate Authorized Representative of Avestra, disclaims all liability of Avestra, STE and its Associates for any loss or damage suffered by any person by reason of the use by that person of, or their reliance on any information contained herein, whether arising from the negligence of Avestra, STE or its Associates or otherwise. Refer also to the full disclaimer at the back of each newsletter Edition and our Terms of Use. How to Write Your Own Stock & Futures Trading Plan Copyright© 2008 Tim Wilcox, Jim Berg, John Atkinson & Sharetradingeducation.com 111 CHAPTER 10 TRADING PLAN TEMPLATE SUMMARY & CONCLUSION If you have got this far and answered all the questions – CONGRATULATIONS! You are now among a minority of traders who have a detailed and tested plan. Your future success as a trader is by no means guaranteed, but by completing this template and creating your very own bespoke trading plan, the odds have shifted significantly in your favour. Now it’s your turn to create your Trading Plan. To help you get started, we conclude this ebook with a summary of the main questions we have covered in this Trading Plan Template in a tabular form. As John Atkinson wrote in the Introduction: “ So it is with the utmost conviction that I now urge you to not only read this ebook, but then to take the time to sit down and actively create your own Trading Plan step-by-step using this Template, together with any other information you may have accumulated. Take your time. Believe me it will be worth your effort. It will probably be the most valuable research time you ever spend in the market.” Copy or print off the following sample summary of questions and use it as your starting point. Increase the space required to suit your Plan. Go back and use the sample answers we have given as a prompt to help you work through your Pan to suit your personality, goals and lifestyle. If you have any constructive criticism about this document, or aspects of your own plan that are not included in this template that might benefit others, then please post your views and ideas on Tim Wilcox’s thread at Trade2win.com. or at ‘Ask Jim Berg’ at www.sharescene.com TW: In my original ebook I wrote: “Roll Up, Roll Up . . . The perfect complement to this document would be a handful of completed trading plans created using the template. In an ideal world, there would be at least three: one for index futures traders, one for forex traders and one for stocks traders. Each of the plans would also cover the three main timeframes: day trader, swing trader and position trader. Self evidently, trading plans contain a lot of highly personal information that, understandably, most traders would not want published on a public forum like T2W. Such details could be blanked out and your anonymity could be guaranteed to protect you from e-mails and private messages etc. Real plans created using the template would put ‘flesh on the bones’ of the template and provide a valuable insight into how different traders interpret it. So, please let other traders benefit and learn from your plan. You have nothing to fear and the wider trading community has much to gain.” My heartfelt thanks to Jim Berg and John Atkinson for doing such a great job of adding Jim’s proven stock trading system from their Investing & Online Trading newsletter and Jim’s Stock Disclaimer: Direct investing in the stock market can result in financial loss. Historical results are no guarantee of future returns. No representation is being made that any account will or is likely to achieve profits or losses similar to those shown. Stock tips or ‘buy’ or sell recommendations are not provided. This educational information is not designed to replace your Licensed Financial Consultant or your Stockbroker. It has been prepared without regard to any particular person's investment objectives, financial situation and particular needs. This information is of a general nature only so you should seek advice from your broker or other investment advisors as appropriate before taking any action. The decision to trade and the method of trading is for the reader alone to decide. Avestra Securities Pty Ltd (Avestra) AFSL 292464, and ShareTradingEducation.com (“STE”), as Corporate Authorized Representative of Avestra, disclaims all liability of Avestra, STE and its Associates for any loss or damage suffered by any person by reason of the use by that person of, or their reliance on any information contained herein, whether arising from the negligence of Avestra, STE or its Associates or otherwise. Refer also to the full disclaimer at the back of each newsletter Edition and our Terms of Use. 112 How to Write Your Own Stock & Futures Trading Plan Copyright© 2008 Tim Wilcox, Jim Berg, John Atkinson & Sharetradingeducation.com Trading Handbook. My sincere thanks also to Mark Douglas, Daryl Guppy, Alan Hull, Ralph Marston Jr. and Dr Brett Steenbarger for their valuable contributions to this ebook and Appendix. The invitation remains for index futures and forex info@sharetradingeducation.com or through the link above. traders to contact us at Good luck and happy trading! Tim Wilcox November 2008 JB: We echo Tim’s thanks to the authors mentioned above. Also our thanks to Kevin Burke, a private trader and recent newsletter member who spent many late night hours proof reading the draft of this ebook and provided several useful suggestions. Tim, John and I hope that this Trading Plan Template will have helped both novice and experienced traders understand the importance of having a Trading Plan. Secondly, that between us we have provided both the impetus and the means for you to now create or update your own Trading Plan - and that you will then go on to adhere to it. This Template is the skeleton. Now it really is up to you to add the meat. Where to start? You may choose to borrow the ideas we have presented in this manual or use the system you may have developed or borrowed already. Importantly, test and measure everything historically on paper and develop your skills and confidence before contemplating investing even a small amount of real funds in the market. Trade what you see and not what you feel - and always with Weight-of-Evidence Jim Berg November 2008 Disclaimer: Direct investing in the stock market can result in financial loss. Historical results are no guarantee of future returns. No representation is being made that any account will or is likely to achieve profits or losses similar to those shown. Stock tips or ‘buy’ or sell recommendations are not provided. This educational information is not designed to replace your Licensed Financial Consultant or your Stockbroker. It has been prepared without regard to any particular person's investment objectives, financial situation and particular needs. This information is of a general nature only so you should seek advice from your broker or other investment advisors as appropriate before taking any action. The decision to trade and the method of trading is for the reader alone to decide. Avestra Securities Pty Ltd (Avestra) AFSL 292464, and ShareTradingEducation.com (“STE”), as Corporate Authorized Representative of Avestra, disclaims all liability of Avestra, STE and its Associates for any loss or damage suffered by any person by reason of the use by that person of, or their reliance on any information contained herein, whether arising from the negligence of Avestra, STE or its Associates or otherwise. Refer also to the full disclaimer at the back of each newsletter Edition and our Terms of Use. 113 How to Write Your Own Stock & Futures Trading Plan Copyright© 2008 Tim Wilcox, Jim Berg, John Atkinson & Sharetradingeducation.com TRADING PLAN TEMPLATE SUMMARY Ref. Query 5.3 Why do You Want to be an Investor or Trader? 5.4 What Sort of Trader or Investor are You? 5.5 What are Your Strengths and Weaknesses? 5.6 Are You in the Right Frame of Mind to Invest? 5.7 What are Your Income Targets? 6.2 What are Your Annual Trading Goals? 6.3 What are Your Monthly Trading Goals? 6.4 What are Your Weekly Investing Goals? 6.5 What are Your Daily Investing Goals? Response Disclaimer: Direct investing in the stock market can result in financial loss. Historical results are no guarantee of future returns. No representation is being made that any account will or is likely to achieve profits or losses similar to those shown. Stock tips or ‘buy’ or sell recommendations are not provided. This educational information is not designed to replace your Licensed Financial Consultant or your Stockbroker. It has been prepared without regard to any particular person's investment objectives, financial situation and particular needs. This information is of a general nature only so you should seek advice from your broker or other investment advisors as appropriate before taking any action. The decision to trade and the method of trading is for the reader alone to decide. Avestra Securities Pty Ltd (Avestra) AFSL 292464, and ShareTradingEducation.com (“STE”), as Corporate Authorized Representative of Avestra, disclaims all liability of Avestra, STE and its Associates for any loss or damage suffered by any person by reason of the use by that person of, or their reliance on any information contained herein, whether arising from the negligence of Avestra, STE or its Associates or otherwise. Refer also to the full disclaimer at the back of each newsletter Edition and our Terms of Use. 114 How to Write Your Own Stock & Futures Trading Plan Copyright© 2008 Tim Wilcox, Jim Berg, John Atkinson & Sharetradingeducation.com TRADING PLAN TEMPLATE SUMMARY Item Query 7.1 Which Markets will you Trade or Invest? 7.2 Which Instruments will You Trade or Invest? 7.3 Which Timeframes will you Trade or Invest? 8.1 Which Financial Vehicle will you Use to Trade or Invest? 8.2 Which Broker and Trading Platform will You Use to Trade or Invest? Which Software & Data Feeds will you Use to Trade or Invest? 8.3 9.2 What is Your Daily Pre-market Routine? 9.3 Have You Analysed Yesterday’s Trades? 9.4 Have You Any Positions Open? Response Disclaimer: Direct investing in the stock market can result in financial loss. Historical results are no guarantee of future returns. No representation is being made that any account will or is likely to achieve profits or losses similar to those shown. Stock tips or ‘buy’ or sell recommendations are not provided. This educational information is not designed to replace your Licensed Financial Consultant or your Stockbroker. It has been prepared without regard to any particular person's investment objectives, financial situation and particular needs. This information is of a general nature only so you should seek advice from your broker or other investment advisors as appropriate before taking any action. The decision to trade and the method of trading is for the reader alone to decide. Avestra Securities Pty Ltd (Avestra) AFSL 292464, and ShareTradingEducation.com (“STE”), as Corporate Authorized Representative of Avestra, disclaims all liability of Avestra, STE and its Associates for any loss or damage suffered by any person by reason of the use by that person of, or their reliance on any information contained herein, whether arising from the negligence of Avestra, STE or its Associates or otherwise. Refer also to the full disclaimer at the back of each newsletter Edition and our Terms of Use. 115 How to Write Your Own Stock & Futures Trading Plan Copyright© 2008 Tim Wilcox, Jim Berg, John Atkinson & Sharetradingeducation.com TRADING PLAN TEMPLATE SUMMARY Item Query 9.5 What are the General Market Conditions? 9.6 What Will You Do Today – Hour by Hour? 9.7 Which Instruments are on Your Watch List? 10.2 What is Your Attitude Towards Risk? 10.3 What is the Overall Market Risk? 10.4 What is the Sector Risk? 10.5 What is the Broker and Hardware Risk? 10.6 What is the Strategy Risk? 10.7 Response What is the Probability of a Successful Trade? Disclaimer: Direct investing in the stock market can result in financial loss. Historical results are no guarantee of future returns. No representation is being made that any account will or is likely to achieve profits or losses similar to those shown. Stock tips or ‘buy’ or sell recommendations are not provided. This educational information is not designed to replace your Licensed Financial Consultant or your Stockbroker. It has been prepared without regard to any particular person's investment objectives, financial situation and particular needs. This information is of a general nature only so you should seek advice from your broker or other investment advisors as appropriate before taking any action. The decision to trade and the method of trading is for the reader alone to decide. Avestra Securities Pty Ltd (Avestra) AFSL 292464, and ShareTradingEducation.com (“STE”), as Corporate Authorized Representative of Avestra, disclaims all liability of Avestra, STE and its Associates for any loss or damage suffered by any person by reason of the use by that person of, or their reliance on any information contained herein, whether arising from the negligence of Avestra, STE or its Associates or otherwise. Refer also to the full disclaimer at the back of each newsletter Edition and our Terms of Use. 116 How to Write Your Own Stock & Futures Trading Plan Copyright© 2008 Tim Wilcox, Jim Berg, John Atkinson & Sharetradingeducation.com TRADING PLAN TEMPLATE SUMMARY Item Query 10.8 What is the RiskReward Ratio? 10.9 What is Your Risk Per Trade? 10.10 Where Will You Place Your Stop Loss Orders? 10.11 When Will You Stop Trading? 10.12 Large Draw downs and Profits – What Will You do? 10.13 Which Money Management Approaches Will You Utilise? 10.14 How Will You Lock In Profits? 10.15 How Will You Determine Your Position Size? 11.2 Response Losing trades - Will You Exit Before Your Stop is Hit? Disclaimer: Direct investing in the stock market can result in financial loss. Historical results are no guarantee of future returns. No representation is being made that any account will or is likely to achieve profits or losses similar to those shown. Stock tips or ‘buy’ or sell recommendations are not provided. This educational information is not designed to replace your Licensed Financial Consultant or your Stockbroker. It has been prepared without regard to any particular person's investment objectives, financial situation and particular needs. This information is of a general nature only so you should seek advice from your broker or other investment advisors as appropriate before taking any action. The decision to trade and the method of trading is for the reader alone to decide. Avestra Securities Pty Ltd (Avestra) AFSL 292464, and ShareTradingEducation.com (“STE”), as Corporate Authorized Representative of Avestra, disclaims all liability of Avestra, STE and its Associates for any loss or damage suffered by any person by reason of the use by that person of, or their reliance on any information contained herein, whether arising from the negligence of Avestra, STE or its Associates or otherwise. Refer also to the full disclaimer at the back of each newsletter Edition and our Terms of Use. 117 How to Write Your Own Stock & Futures Trading Plan Copyright© 2008 Tim Wilcox, Jim Berg, John Atkinson & Sharetradingeducation.com TRADING PLAN TEMPLATE SUMMARY Item Query 11.3 Losing trades – Which Signals Will See You Exit Early? 11.4 Winning Trades – Which Signals Will See You Exit Completely? 11.5 Winning Trades – Which Signals Will See You Close Half? 11.6 Winning Trades – Which Signals Will See You Close the Remainder? 12.2 Which Strategies Will You Trade? 12.3 What are Your Setups? 12.4 How Will You Find Your Setups? 12.5 Which Signals Will Trigger Your Entry? 13.2 Have You Recorded Today’s Trades? Response Disclaimer: Direct investing in the stock market can result in financial loss. Historical results are no guarantee of future returns. No representation is being made that any account will or is likely to achieve profits or losses similar to those shown. Stock tips or ‘buy’ or sell recommendations are not provided. This educational information is not designed to replace your Licensed Financial Consultant or your Stockbroker. It has been prepared without regard to any particular person's investment objectives, financial situation and particular needs. This information is of a general nature only so you should seek advice from your broker or other investment advisors as appropriate before taking any action. The decision to trade and the method of trading is for the reader alone to decide. Avestra Securities Pty Ltd (Avestra) AFSL 292464, and ShareTradingEducation.com (“STE”), as Corporate Authorized Representative of Avestra, disclaims all liability of Avestra, STE and its Associates for any loss or damage suffered by any person by reason of the use by that person of, or their reliance on any information contained herein, whether arising from the negligence of Avestra, STE or its Associates or otherwise. Refer also to the full disclaimer at the back of each newsletter Edition and our Terms of Use. 118 How to Write Your Own Stock & Futures Trading Plan Copyright© 2008 Tim Wilcox, Jim Berg, John Atkinson & Sharetradingeducation.com TRADING PLAN TEMPLATE SUMMARY Item Query 13.3 Did You Execute Your Trades According to Your Plan? 13.4 Have You Completed Your Trading Journal? 14.2 Back Test or Forward Test? 14.3 What are Your Promises to Yourself? 14.4 What Questions do You Ask After a Winning Trade? 14.5 What Questions do You Ask After a Losing Trade? 14.6 What Steps do You Take to Learn More About Trading? Response Disclaimer: Direct investing in the stock market can result in financial loss. Historical results are no guarantee of future returns. No representation is being made that any account will or is likely to achieve profits or losses similar to those shown. Stock tips or ‘buy’ or sell recommendations are not provided. This educational information is not designed to replace your Licensed Financial Consultant or your Stockbroker. It has been prepared without regard to any particular person's investment objectives, financial situation and particular needs. This information is of a general nature only so you should seek advice from your broker or other investment advisors as appropriate before taking any action. The decision to trade and the method of trading is for the reader alone to decide. Avestra Securities Pty Ltd (Avestra) AFSL 292464, and ShareTradingEducation.com (“STE”), as Corporate Authorized Representative of Avestra, disclaims all liability of Avestra, STE and its Associates for any loss or damage suffered by any person by reason of the use by that person of, or their reliance on any information contained herein, whether arising from the negligence of Avestra, STE or its Associates or otherwise. Refer also to the full disclaimer at the back of each newsletter Edition and our Terms of Use. How to Write Your Own Stock & Futures Trading Plan Copyright© 2008 Tim Wilcox, Jim Berg, John Atkinson & Sharetradingeducation.com 119 BIBLIOGRAPHY Atkinson, John & Berg Jim, Investing & Online Trading stock market newsletter,Sharetradingeducation.com 2008 Atkinson, John, The Atkinson-Guppy Articles Ebook,Sharetradingeducation.com 2004 Atkinson, John, 10 Secrets to Profitable Online Stock & Share Trading Ebook, 2005 Bedford, Louise, The Secret of Candlestick Charting, Australia, Wrightbooks, 1999 Bedford, Louise, Trading Secrets, Australia, Wrightbooks, 2001 Bedford Louise, Charting Secrets, Australia, Wrightbooks 2004 Berg, Jim, The Stock Trading Handbook- Fundamental & Technical Analysis Combined Ebook 2005 Berg Jim, JB Combo - Home Study ‘Trading Strategies with JB Premium Charts, ShareTradingEDucation.com, 2007 Berg Jim, Home Study Course, ‘Trading Strategies with Metastock’, Sharetradingeducation.com, 2005 Douglas, Mark, The Disciplined Trader, Pearson Professional Education,1990 Elder, Dr. Alexander, Trading for a Living, USA, John Wiley & Sons, 1993 Elder, Dr. Alexander, Come into my Trading Room, USA, John Wiley & Sons, 2002 Guppy, Daryl, Share Trading, Australia, John Wiley & Sons, 1996 Guppy, Daryl, Better Trading, Australia, John Wiley & Sons, 2001 Guppy, Daryl, Snapshot Trading, Australia, John Wiley & Sons, 2002 Guppy, Daryl, Trend Trading, Australia, John Wiley & Sons, 2004 Guppy, Daryl, Tutorials in Applied Technical Analysis , weekly share trading newsletter from www.Guppytraders.com. Hull, Allan, Active Investing, Australia, John Wiley & Sons, 2001 Hull, Alan, Charting in a Nutshell, Australia, John Wiley & Sons,2002 Hull, Allan, Active Retirement, Australia, John Wiley & Sons, 2005 Hull, Alan Blue Chip Investing, Australia, John Wiley & Sons, 2007 Hull, Alan Acting Investing & Active Trading weekly newsletters from Alan Hull Lewis, Max Conditional Order Trading Strategies (COTS) Ebook Sharetradingeducation.com 2004 Tate, Chris, The Art of Trading, Australia, Wrightbooks, 1997 Tharp, Van K., Trade Your Way to Financial Freedom, USA, McGraw-Hill, 1999 Watkins, Frank, Exploding The Myths, Australia, Vocational Education & Training Publications, 2003 Steenbarger, Brett N. Ph.D.,The Psychology of Trading, John Wiley & Sons, 2003 Disclaimer: Direct investing in the stock market can result in financial loss. Historical results are no guarantee of future returns. No representation is being made that any account will or is likely to achieve profits or losses similar to those shown. Stock tips or ‘buy’ or sell recommendations are not provided. This educational information is not designed to replace your Licensed Financial Consultant or your Stockbroker. It has been prepared without regard to any particular person's investment objectives, financial situation and particular needs. This information is of a general nature only so you should seek advice from your broker or other investment advisors as appropriate before taking any action. The decision to trade and the method of trading is for the reader alone to decide. Avestra Securities Pty Ltd (Avestra) AFSL 292464, and ShareTradingEducation.com (“STE”), as Corporate Authorized Representative of Avestra, disclaims all liability of Avestra, STE and its Associates for any loss or damage suffered by any person by reason of the use by that person of, or their reliance on any information contained herein, whether arising from the negligence of Avestra, STE or its Associates or otherwise. Refer also to the full disclaimer at the back of each newsletter Edition and our Terms of Use. How to Write Your Own Stock & Futures Trading Plan Copyright© 2008 Tim Wilcox, Jim Berg, John Atkinson & Sharetradingeducation.com 120 GLOSSARY Advance/Decline Line All Ordinaries Accumulation Index All Ordinaries Share Price Index (All Ords) American-Style Option Arbitrage Ask Asset Allocation Asset Backing These are just some of words defined in our A to Z Glossary of Terms of over 20 pages. You are invited to download the Glossary Appendix from Jim Berg’s ‘Stock Trading Handbook Fundamental & Technical Analysis Combined’ with our compliments. Log in at our Free Downloads section at www.sharetradingeducation.com: Click Here. Disclaimer: Direct investing in the stock market can result in financial loss. Historical results are no guarantee of future returns. No representation is being made that any account will or is likely to achieve profits or losses similar to those shown. Stock tips or ‘buy’ or sell recommendations are not provided. This educational information is not designed to replace your Licensed Financial Consultant or your Stockbroker. It has been prepared without regard to any particular person's investment objectives, financial situation and particular needs. This information is of a general nature only so you should seek advice from your broker or other investment advisors as appropriate before taking any action. The decision to trade and the method of trading is for the reader alone to decide. Avestra Securities Pty Ltd (Avestra) AFSL 292464, and ShareTradingEducation.com (“STE”), as Corporate Authorized Representative of Avestra, disclaims all liability of Avestra, STE and its Associates for any loss or damage suffered by any person by reason of the use by that person of, or their reliance on any information contained herein, whether arising from the negligence of Avestra, STE or its Associates or otherwise. Refer also to the full disclaimer at the back of each newsletter Edition and our Terms of Use. How to Write Your Own Stock & Futures Trading Plan Copyright© 2008 Tim Wilcox, Jim Berg, John Atkinson & Sharetradingeducation.com 121 JIM BERG’s & OTHER TRADING TOOLS • J B Premium Charts and complete JB Combo package • Investing & Online Trading Newsletter • JB Volatility Indicators • Home Study Course • John Atkinson’s Training Resources • Charting Software • Scanning Software • Jim Berg Seminars and Boot Camp • Ask Jim Berg at www.ShareScene.com Disclaimer: Direct investing in the stock market can result in financial loss. Historical results are no guarantee of future returns. No representation is being made that any account will or is likely to achieve profits or losses similar to those shown. Stock tips or ‘buy’ or sell recommendations are not provided. This educational information is not designed to replace your Licensed Financial Consultant or your Stockbroker. It has been prepared without regard to any particular person's investment objectives, financial situation and particular needs. This information is of a general nature only so you should seek advice from your broker or other investment advisors as appropriate before taking any action. The decision to trade and the method of trading is for the reader alone to decide. Avestra Securities Pty Ltd (Avestra) AFSL 292464, and ShareTradingEducation.com (“STE”), as Corporate Authorized Representative of Avestra, disclaims all liability of Avestra, STE and its Associates for any loss or damage suffered by any person by reason of the use by that person of, or their reliance on any information contained herein, whether arising from the negligence of Avestra, STE or its Associates or otherwise. Refer also to the full disclaimer at the back of each newsletter Edition and our Terms of Use. How to Write Your Own Stock & Futures Trading Plan Copyright© 2008 Tim Wilcox, Jim Berg, John Atkinson & Sharetradingeducation.com 122 Jim Berg’s Complete JB Combo of Home Study + Charting + Data + Support If you’re looking for a complete all-in-one, low cost, best value combo package of Stock charting program & data Home Study Course and Mentoring support for the Australian share market then look no further. You have found the best. In the comfort of your own home, learn Jim Berg’s profitable trading strategies that really work. At a mere fraction of the price you’d have to pay anywhere else, here’s what you’ll receive: ¾ Jim Berg’s ‘Trading Strategies for JB Premium Charts’ Home Study Course discover how you can successfully combine fundamental and technical analysis ¾ Simple-to-use JB Premium Charts stock charting program ¾ Jim Berg’s world famous JB Volatility Indicators ¾ Jim Berg’s watch lists – from fundamental scans, monopolies, ‘Expert Picks’ etc ¾ One month’s email support from Jim Berg ¾ 1 year end-of-day JB Premium Stock Market Price ASX Data & history since 1990 For more on Jim Berg’s JB Combo Click Here Disclaimer: Direct investing in the stock market can result in financial loss. Historical results are no guarantee of future returns. No representation is being made that any account will or is likely to achieve profits or losses similar to those shown. Stock tips or ‘buy’ or sell recommendations are not provided. This educational information is not designed to replace your Licensed Financial Consultant or your Stockbroker. It has been prepared without regard to any particular person's investment objectives, financial situation and particular needs. This information is of a general nature only so you should seek advice from your broker or other investment advisors as appropriate before taking any action. The decision to trade and the method of trading is for the reader alone to decide. Avestra Securities Pty Ltd (Avestra) AFSL 292464, and ShareTradingEducation.com (“STE”), as Corporate Authorized Representative of Avestra, disclaims all liability of Avestra, STE and its Associates for any loss or damage suffered by any person by reason of the use by that person of, or their reliance on any information contained herein, whether arising from the negligence of Avestra, STE or its Associates or otherwise. Refer also to the full disclaimer at the back of each newsletter Edition and our Terms of Use. How to Write Your Own Stock & Futures Trading Plan Copyright© 2008 Tim Wilcox, Jim Berg, John Atkinson & Sharetradingeducation.com 123 We hope you have enjoyed reading this ebook. The aim of this publication is to provide a framework of questions and suggested answers to help investors understand themselves and how they will act and react when investing and trading the stock market. The ultimate goal for individuals is to get their emotions under control, improve their discipline and overall performance. To easily find other resources, we have provided a series of hyperlinks within the document which you can click on to discover further information on the web. A craftsman uses precision tools to hone his skills. The following are some of the trading and investing tools available at our site www.sharetradingeducation.com, some of which are available to you with significant discounts as a reader of this ebook: 1) Investing and Online Trading Newsletter In our newsletter, my business partner John Atkinson and I continue the theme and principles of this Trading Plan ebook by featuring: On-going step-by-step weekly education on the research & selection of stocks. How to structure your portfolio for more stability, flexibility & lower risk The selection & management of stocks with portfolio examples . Additional progressive instruction by world class expert authors/speakers Daryl Guppy, Alan Hull, Dr Brett Steenbarger, Dr Van Tharp & others. To become a Member of our mentoring style Newsletter Click Here Now. 2) JB Volatility Indicators Throughout this ebook I have explained the main long term investing and short term trading strategies which I use. Most of the charts included the template of indicators which I apply on my own charts, as part of my approach developed over more than twenty five years of trading: JB Alert Signal JB Volatility Entry Signal (red to blue bar) JB Profit Taker Volatility Trailing Stop Loss These Indicators form part of my JB Premium Charts package, which in turn is part of my complete JB Combo of Home Study+ charting + ASX data and history + email support. For Metastock users, these Indicators are also available in my Metastock Volatility Charting Template. Disclaimer: Direct investing in the stock market can result in financial loss. Historical results are no guarantee of future returns. No representation is being made that any account will or is likely to achieve profits or losses similar to those shown. Stock tips or ‘buy’ or sell recommendations are not provided. This educational information is not designed to replace your Licensed Financial Consultant or your Stockbroker. It has been prepared without regard to any particular person's investment objectives, financial situation and particular needs. This information is of a general nature only so you should seek advice from your broker or other investment advisors as appropriate before taking any action. The decision to trade and the method of trading is for the reader alone to decide. Avestra Securities Pty Ltd (Avestra) AFSL 292464, and ShareTradingEducation.com (“STE”), as Corporate Authorized Representative of Avestra, disclaims all liability of Avestra, STE and its Associates for any loss or damage suffered by any person by reason of the use by that person of, or their reliance on any information contained herein, whether arising from the negligence of Avestra, STE or its Associates or otherwise. Refer also to the full disclaimer at the back of each newsletter Edition and our Terms of Use. How to Write Your Own Stock & Futures Trading Plan Copyright© 2008 Tim Wilcox, Jim Berg, John Atkinson & Sharetradingeducation.com 124 3) Home Study Course My Home Study Course builds on what you have learnt here. All participants receive one month email support directly from me to help them solve their trading problems. My ‘Trading Strategies’ Home Study course component is available in a choice of 2 formats: i) For JB Premium Charts users: It is also part of my JB Combo package ii) For Metastock users: This format contains the Volatility Template above and is available separately. There is no other Metastock trading course available like this. Some sample pages are available in our Free Downloads Section at our site. 4) John Atkinson’s Training Materials Chapter 4 also stressed the importance of using sound money and risk management principles. John Atkinson has designed a series of two Money and Risk Management Portfolio Tools: Atkinson Portfolio Planner ©- pre-trade planning of sector & stock selection & portfolio risk Atkinson Trade Optimizer ©- pre-trade analysis of which stock to buy from a qualified group of companies that meet specific trading criteria Please click on the following links for more details on John Atkinson’s: o Atkinson Portfolio Tools o Ebooks – ‘The Atkinson-Guppy Articles’ & our co-authored ‘ 10 Secrets to Profitable Trading’, o Money & Risk Management course module, based on Daryl Guppy’s work 5) Charting Software We use our JB Premium Charts package which includes: My JB Volatility Indicators My series of watch lists and 12 months data and history data These are combined with my Home Study Course ‘Trading Strategies with JB Premium Charts’ in my complete JB Combo package – the very best value educational resource available today. Metastock users can add my JB Indicators using my Volatility Charting Template. Disclaimer: Direct investing in the stock market can result in financial loss. Historical results are no guarantee of future returns. No representation is being made that any account will or is likely to achieve profits or losses similar to those shown. Stock tips or ‘buy’ or sell recommendations are not provided. This educational information is not designed to replace your Licensed Financial Consultant or your Stockbroker. It has been prepared without regard to any particular person's investment objectives, financial situation and particular needs. This information is of a general nature only so you should seek advice from your broker or other investment advisors as appropriate before taking any action. The decision to trade and the method of trading is for the reader alone to decide. Avestra Securities Pty Ltd (Avestra) AFSL 292464, and ShareTradingEducation.com (“STE”), as Corporate Authorized Representative of Avestra, disclaims all liability of Avestra, STE and its Associates for any loss or damage suffered by any person by reason of the use by that person of, or their reliance on any information contained herein, whether arising from the negligence of Avestra, STE or its Associates or otherwise. Refer also to the full disclaimer at the back of each newsletter Edition and our Terms of Use. How to Write Your Own Stock & Futures Trading Plan Copyright© 2008 Tim Wilcox, Jim Berg, John Atkinson & Sharetradingeducation.com 125 Daryl Guppy’s chart screenshots uses GuppyTradersEssentials full charting software. Readers who have other programs and who may also wish to use Daryl Guppy’s price projection tools, parabolic trend line, Guppy Multiple Moving Average (GMMA) etc may be interested in the Guppy Toolbox which plugs into Metastock and many other software programs. Pro Trader and BullCharts are also available at our site, with more detailed descriptions presented there. Both these programs feature easy to use and powerful explorations. 6) Scanning Software In Chapter 3 we featured two different types of scanning software: Scanvest system testing – for a 16 day free trial Click Here Market Scan for Fundamental Analysis – Click Here 7) Jim Berg Seminars and Boot Camp I regularly conduct Jim Berg Seminars across Australia and occasionally in other countries. I also run a two day ‘Jim Berg Boot Camp’ – an intensive trading workshop, where I teach the trading strategies outlined in this ebook and more. The consistently positive feedback has been overwhelming. All new attendees receive a copy of my indepth Home Study Course and 12 months email support as part of their registration. Significant discounts are available for newsletter members, previous purchasers of my JB Combo and Home Study Course and for partners. For details of my next weekend Boot Camp, Click Here . 8) Ask Jim Berg at www.sharescene.com Disclaimer: Direct investing in the stock market can result in financial loss. Historical results are no guarantee of future returns. No representation is being made that any account will or is likely to achieve profits or losses similar to those shown. Stock tips or ‘buy’ or sell recommendations are not provided. This educational information is not designed to replace your Licensed Financial Consultant or your Stockbroker. It has been prepared without regard to any particular person's investment objectives, financial situation and particular needs. This information is of a general nature only so you should seek advice from your broker or other investment advisors as appropriate before taking any action. The decision to trade and the method of trading is for the reader alone to decide. Avestra Securities Pty Ltd (Avestra) AFSL 292464, and ShareTradingEducation.com (“STE”), as Corporate Authorized Representative of Avestra, disclaims all liability of Avestra, STE and its Associates for any loss or damage suffered by any person by reason of the use by that person of, or their reliance on any information contained herein, whether arising from the negligence of Avestra, STE or its Associates or otherwise. Refer also to the full disclaimer at the back of each newsletter Edition and our Terms of Use. How to Write Your Own Stock & Futures Trading Plan Copyright© 2008 Tim Wilcox, Jim Berg, John Atkinson & Sharetradingeducation.com 126 If you have any questions about the topics covered in this ebook or in our ‘Investing & Online Trading’ stock market newsletter, drop me a line at info@sharetradingeducation.com For general questions about the market, then post them at the unique ‘Ask Jim Berg’ section at the popular ShareScene.com forum. You will find this page by registering at www.sharescene.com then going to ‘Ask Jim Berg’. This Australian share market discussion forum combines modern technology with a rapidly growing member base of savvy investors. Keep up to date with the latest finance, business and investment related information and benefit from thousands of combined years of share trading experience. Trade with Weight-of-Evidence To your success, Jim Berg November 2008 Disclaimer: Direct investing in the stock market can result in financial loss. Historical results are no guarantee of future returns. No representation is being made that any account will or is likely to achieve profits or losses similar to those shown. Stock tips or ‘buy’ or sell recommendations are not provided. This educational information is not designed to replace your Licensed Financial Consultant or your Stockbroker. It has been prepared without regard to any particular person's investment objectives, financial situation and particular needs. This information is of a general nature only so you should seek advice from your broker or other investment advisors as appropriate before taking any action. The decision to trade and the method of trading is for the reader alone to decide. Avestra Securities Pty Ltd (Avestra) AFSL 292464, and ShareTradingEducation.com (“STE”), as Corporate Authorized Representative of Avestra, disclaims all liability of Avestra, STE and its Associates for any loss or damage suffered by any person by reason of the use by that person of, or their reliance on any information contained herein, whether arising from the negligence of Avestra, STE or its Associates or otherwise. Refer also to the full disclaimer at the back of each newsletter Edition and our Terms of Use.


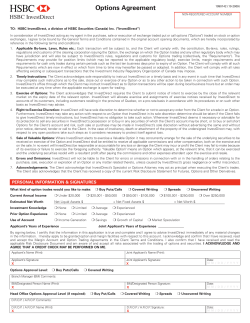


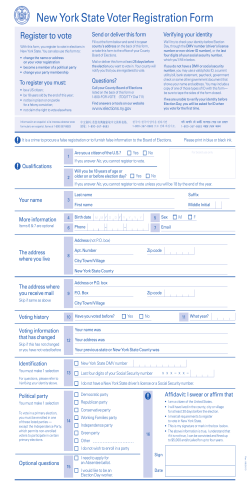


© Copyright 2025