Study Area Catch & Water temperature Results
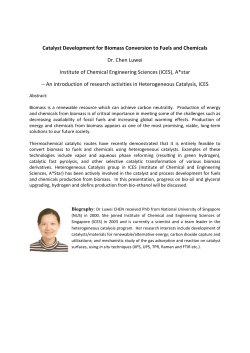
Session 4: Strategies for the management of mixed commercial, recreational, and/or subsistence fisheries Investigation on Biological Parameters of Pollock Population in Korean Waters Sukyung Kang, Minkyoung Bang*, Jeong-Ho Park, Myung-Ho Son, and Suam Kim* National Fisheries Research & Development Institute, Korea, *Pukyong National University, Korea Korean water is a southern boundary of walleye pollock (pollock hereafter) distribution in the northwestern Pacific. Pollock stocks and its related fisheries have been changed dramatically since the commercial fisheries begun in the early 20th century in Korean waters: the highest catch in 1930s, sudden decrease during 1950s~1960s due to low fishing activity, and another boom in 1970s~1980s before they collapsed completely in 2000s. Since the late 1990s, pollock fisheries in Korean waters have been considered collapsed. Though many fisheries scientists suspect that such a collapse might have been triggered by overexploitation of the pollock population and ocean warming, there is no scientific evidence that supports such conjectures. Our study was motivated by the depleted status of the pollock population, and we intend to investigate why they disappeared. Study Area RUSSIA East Sea KOREA Catch & Water temperature Catch of pollock in Korean waters High Low High juvenile ratio in catch • in weigh Seawater temperature • in number • 0m Warm February Cold • Peak of pollock production in the late 1930s • The pollock catch has shown a tremendous decline since the late 1980s. • In particular, since 2000 the pollock stocks were completely collapsed. • 200m annual mean Results & Discussion Variation of condition factor • Yearly variation of condition factor in winter • Monthly variation of condition factor in High/Low Biomass periods GSI Comparison of biological parameters in High/Low Biomass periods High Biomass (1973-1985) Low Biomass (1991-2003) Length F: 36~38cm (25.6%) M: 34~36cm (27.1%) ≪ F: 38~40cm (21.5%) M: 36~38cm (20.6%) Condition Factor in winter 56.87 ≪ 59.96 Length at maturity 37.08cm ≫ 32.00cm GSI PSD Feb. low Jan. high Relative length frequency - Right-skewed Main Findings • Monthly variation of GSI in High/Low Biomass periods Proportional Stock Density (PSD) • Proportional stock density of pollock Overfishing on Pollock Severe fishing pressure on juveniles was common during the 1975-1997 period, and therefore a large portion of pollock catch was juveniles. Warming of seawater Warming trend in the surface layer was evident in winter. However at 200m depth, cold water temperatures were found consistently, and even there were cooling trend in recent years. Possibility of low survival rate & residing depth change Comparison between High and Low Biomass period High GSI appeared 1 month earlier (Feb. Dec. & Jan.) in low biomass period and mean size and condition factor were larger than those in high biomass period. Possibly Density-dependent effect Based on PSD value, we may speculate the weak recruitment in low biomass period. This work was supported by the NFRDI project C-D-2015-0138
© Copyright 2025


