What is the UV Index?
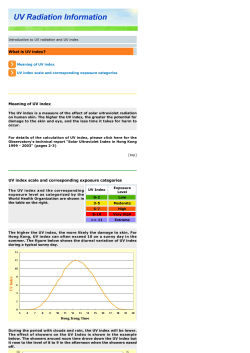
What is the UV Index? The UV Index is a measure of the solar UV (ultraviolet) intensity at the Earth's surface relevant to the effect on human skin. The skindamaging UV radiation is governed by the erythemal action spectrum (Red line in Figure 1). This spectrum has been adopted by the International Commission on Illumination (CIE) to represent the average skin response over the solar UV spectrum. (Source : The International Commission on Illumination) Figure 1 Erythemal action spectrum. How is the UV Index calculated? The standard way to calculate the UV Index recommended by the World Meteorological Organization (WMO) and the World Health Organization (WHO) is : l l l l measure the intensity of solar UV radiation at different wavelengths up to 400 nanometre (Blue line in Figure 2), multiply these UV intensities by the weighting factors at the corresponding wavelengths in the erythemal action spectrum (Red line in Figure 2) to reflect the human skin's response to each wavelength, sum up the products above to obtain the total erythemally weighted UV intensity in milliwatt/metre2, i.e. area under the red line in Figure 3, multiply the total erythemally weighted UV intensity by 0.04 to obtain the UV Index. (Source : The National Oceanic and Atmospheric Administration) Figure 2 Measured UV intensity across the solar UV spectrum and the erythemal action spectrum. (Source : The National Oceanic and Atmospheric Administration) Figure 3 Total erythemally weighted UV intensity. (Area under the red line) What does the UV Index mean? The UV Index and the corresponding exposure level as categorized by the World Health Organization are shown in the table below. UV Index Exposure Level 0 2 Low 3 5 Moderate 6 7 High 8 10 Very High 11 Extreme (Source : The World Health Organization) The higher the UV Index, the more likely the damage to skin. For Hong Kong, UV Index can often exceed 10 on a sunny day in the summer (Figure 4). During the period with clouds and rain, the UV Index will be lower. The effect of showers on the UV Index is shown in Figure 5. Figure 4 Diurnal variation of UV Index on 14 August 2001 a sunny day with some 12 hours of sunshine. Figure 5 Diurnal variation of UV Index on 2 August 1999. The showers around noon on that day drove down the UV Index but it rose to the level of 8 to 9 in the afternoon when the showers eased off.
© Copyright 2025


