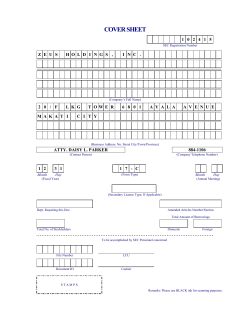
STANDARD DOCUMENT COVER SHEET FOR SEC FILINGS
STANDARD DOCUMENT COVER SHEET
FOR SEC FILINGS
All documents should be submitted under a cover page which clearly identifies the company and
the specific document form as follows:
SEC Number 121
File Number
BANK OF THE PHILIPPINE ISLANDS
BPI BUILDING, 6768 AYALA AVE. CORNER PASEO DE ROXAS
MAKATI CITY, METRO MANILA
818-55-41 to 48
FISCAL YEAR ENDING DECEMBER 31
(indicate if anything above is new and the date it was changed)
SEC FORM 17–Q QUARTERLY REPORT
AMENDMENT DESIGNATION “A”
PERIOD-ENDED March 31, 2011
(if a report, financial statement, GIS, or related amendment or show-cause filing)
NONE
EACH ACTIVE SECONDARY LICENSE TYPE AND FILE NUMBER
(state “NONE” if that is the case)
Page 1 of 16
SECURITIES AND EXCHANGE COMMISSION
SEC FORM 17-Q QUARTERLY REPORT PURSUANT TO SECTION 17 OF THE
SECURITIES REGULATION CODE AND SRC RULE 17 (2) (b) THEREUNDER
1. For the quarterly period ended March 31, 2011
2.
Commission identification number 121
3. BIR Tax identification No. - TIN: 000-438-366-000
4.
BANK OF THE PHILIPPINE ISLANDS
Exact name of registrant as specified in its chart
5.
Philippines
Province, country or other jurisdiction of incorporation
6.
Industry Classification Code: (SEC Use Only)
7.
BANK OF THE PHILIPPINE ISLANDS BUILDING
6768 Ayala Avenue Corner Paseo de Roxas
Makati City
ZIP Code 0720
Address of principal office
Postal Code
8.
(02) 818 5541 to 48
Registrant’s telephone number, including area code
9. Not Applicable
Former name, former address, and former fiscal year, if changed since last report
10. Securities registered pursuant to Sections 8 and 12 of the Code
Title of each class
Number of shares of common stock outstanding
and amount of debt outstanding
Common
3,556,356,173
11. Are any or all of the securities listed on the Philippine Stock Exchange? Yes [x] No [ ]
If yes, state the name of such stock exchange and the classes of securities listed therein:
Philippine Stock Exchange
Common
Page 2 of 16
12. Indicate by check mark whether the registrant:
(a) Has filed all reports required to be filed by Section 17 of the Code and SRC Rule 17 thereunder
or Sections 11 of the RSA and RSA Rule 11(a)-1 thereunder, and Sections 26 and 141 of the
Corporation Code of the Philippines during the preceding 12 months (or for such shorter period the
registrant was required to file such reports) Yes [8] No [ ]
(b) Has been subject to such filing requirements for the last 90 days Yes [8] No [ ]
Page 3 of 16
BANK OF THE PHILIPPINE ISLANDS
CONSOLIDATED STATEMENT OF CONDITION
MARCH 31, 2011 AND DECEMBER 31, 2010
(in Thousands of Pesos)
UNAUDITED
MARCH 31, 2011
AUDITED
DECEMBER 31, 2010
RESOURCES
Cash and Other Cash Items
Due from Bangko Sentral ng Pilipinas
Due from Other Banks
Interbank Loans Receivable and Securities
Purchased under Agreements to Resell
Financial Assets at Fair Value through Profit or Loss
Derivative Financial Assets
Trading Securities
Available for Sale Securities, net
Held-to-Maturity Securities, net
Loans and Advances, net
Bank Premises, Furniture, Fixtures and Equipmen
Investment Properties, net
Assets Held for Sale, net
Equity Investments, net
Assets Attributable to Insurance Operations
Deferred Income Tax Assets, net
Other Resources, net
TOTAL RESOURCES
14,043,053
98,393,226
8,734,255
18,150,991
128,487,493
6,548,011
21,218,779
66,832,907
5,738,912
16,916,383
84,558,155
95,304,856
359,763,670
11,626,863
2,685,847
11,239,316
2,488,247
11,787,106
5,594,074
10,733,847
6,058,892
11,448,815
112,522,947
95,474,303
378,728,447
11,605,982
2,706,049
11,773,668
2,508,088
11,915,613
5,023,075
8,360,277
760,826,588
878,145,558
LIABILITIES AND CAPITAL FUNDS
Deposit Liabilities
Demand
Savings
Time
Sub-total
Derivative Financial Liabilities
Bills Payable
Due to Bangko Sentral ng Pilipinas and Other Ban
Manager's Checks and Demand Drafts Outstandin
Accrued Taxes, Interest and Other Expenses
Unsecured Subordinated Debt
Liabilities Attributable to Insurance Operations
Deferred Credits and Other Liabilities
TOTAL LIABILITIES
121,689,397
247,013,894
235,291,447
603,994,738
120,528,815
245,769,001
353,468,394
719,766,211
5,022,685
26,419,858
1,018,025
4,562,164
3,640,690
5,000,000
9,039,450
19,191,510
5,329,468
24,868,223
2,000,084
4,186,804
5,119,066
5,000,000
9,212,827
20,388,544
677,889,121
795,871,226
CAPITAL FUNDS ATTRIBUTABLE TO THE EQUITY HOLDERS OF BPI
Capital Stock
35,562,265
Paid-in Surplus
8,316,838
Reserves
1,323,521
Surplus
38,215,500
Accumulated Other Comprehensive Loss
(1,764,006)
Non-controlling Interest
TOTAL CAPITAL FUNDS
TOTAL LIABILITIES AND CAPITAL
35,562,265
8,316,838
1,366,683
35,317,835
466,175
81,654,117
81,029,796
1,283,350
82,937,468
1,244,536
82,274,332
760,826,588
878,145,558
Page 4 of 16
BANK OF THE PHILIPPINE ISLANDS
CONSOLIDATED STATEMENTS OF INCOME
For the Three Months Ended March 31, 2011 and 2010
(In Thousands of Pesos)
Unaudited
2011
INTEREST INCOME
On loans and advances
On held-to-maturity securities
On available-for-sale securities
On deposits with BSP and other banks
On trading securities
Gross Receipts Tax
INTEREST EXPENSE
On Deposits
On Bills Payable and other borrowings
NET INTEREST INCOME
IMPAIRMENT LOSSES
NET INTEREST INCOME AFTER IMPAIRMENT
LOSSES
OTHER INCOME
Fees and commissions
Income from foreign exchange trading
Trading gain (loss) on securities
Income attributable to insurance operations
Other operating income
Gross Receipts Tax
OTHER EXPENSES
Compensation and fringe benefits
Occupancy and equipment-related expenses
Other operating expenses
INCOME BEFORE INCOME TAX
PROVISION FOR INCOME TAX
Current
Deferred
NET INCOME FOR THE PERIOD
Attributable to:
Equity holders of BPI
Non-controlling interest
Earnings per share:
Based on 3,556,356,173 shares as of March 31, 2011
and 3,247,022,287 shares in 2010
P
Unaudited
2010
6,353,139
1,574,622
916,329
765,190
174,857
(352,961)
9,431,177
5,994,350
1,389,695
577,155
698,626
127,922
(331,779)
8,455,969
2,835,930
309,158
3,145,089
6,286,088
592,244
2,596,574
375,214
2,971,789
5,484,180
623,786
5,693,844
4,860,394
1,143,234
426,273
207,633
242,927
1,287,278
(212,788)
3,094,557
925,828
568,444
549,540
129,216
1,514,293
(266,491)
3,420,831
2,356,639
1,461,980
1,446,665
5,265,284
3,523,116
2,139,255
1,398,959
1,270,845
4,809,059
3,472,166
738,438
(131,937)
606,501
2,916,615
700,089
10,769
710,858
2,761,307
2,854,902
61,713
2,916,615
2,732,189
29,119
2,761,307
0.80
P
0.84
Page 5 of 16
BANK OF THE PHILIPPINE ISLANDS
CONSOLIDATED STATEMENT OF COMPREHENSIVE INCOME
For the Three Months Ended March 31, 2011 and 2010
(In Thousands of Pesos)
Unaudited
Unaudited
2011
2010
NET INCOME BEFORE MINORITY INTEREST
2,916,615
2,761,307
Other Comprehensive Income:
Net change in fair value reserve on available-for-sale securities,
net of tax effect
Fair value reserve on investments of insurance subsidiaries,
net of tax effect
Share in other comprehensive income of associates
Currency translation differences
Total Other Comprehensive Income (Loss), net of tax effect
Total Comprehensive Income for the Year
(2,059,006)
(52,826)
(159,883)
(70,066)
35,815
60,356
985,826
(163,852)
(2,253,140)
663,476
829,505
3,590,812
Attributable to:
Equity holders of BPI
Non-Controlling Interest
624,721
38,754
3,556,297
34,515
663,476
3,590,812
Page 6 of 16
BANK OF THE PHILIPPINE ISLANDS
STATEMENT OF CHANGES IN CAPITAL FUNDS
FOR THE THREE MONTHS ENDED MARCH 31, 2011 & MARCH 31, 2010
(In Thousands of Pesos)
Capital
stock
35,562,265
Balance, December 31, 2010
Total comprehensive income for the year
Employee stock option plan:
Unexercised expired stock option
Cash dividends
Adjustments
Other changes in non-controlling intere
35,562,265
Balance, March 31, 2011
Capital
stock
32,466,688
Balance, December 31, 2009
Total comprehensive income for the year
Employee stock option plan:
Exercise of options
2,235
Cash dividends
Adjustments
Other changes in minority interest
32,468,923
Balance, March 31, 2010
Paid-in
surplus
8,316,838
8,316,838
Paid-in
surplus
1,412,302
8,436
Consolidated
Attributable to equity holders of BPI
Accumulated Other Non-controlling
Comprehensive Income
interest
Reserves
Surplus
1,366,683
35,317,835
466,175
1,244,536
2,854,902
(2,230,181)
38,754
(41,017)
41,017
(2,145)
1,745
1,323,521
(1,764,006)
60
1,283,350
Consolidated
Attributable to equity holders of BPI
Accumulated Other Non-controlling
Comprehensive Income
interest
Reserves
Surplus
1,394,866
33,160,134
(1,636,301)
967,459
2,732,189
824,108
34,515
(15,694)
(3,066)
1,420,738
38,215,500
1,376,107
(2,922,079)
2,085
32,972,329
2,001
(810,192)
1,001,974
Total
82,274,332
663,476
0
(0)
0
(400)
60
82,937,468
Total
67,765,149
3,590,812
0
(5,023)
(2,922,079)
1,020
0
68,429,879
Page 7 of 16
BANK OF THE PHILIPPINE ISLANDS
CONSOLIDATED STATEMENTS OF CASH FLOWS
FOR THE QUARTERS ENDED MARCH 31, 2011 AND MARCH 31, 2010
(In Thousands of Pesos)
2011
CASH FLOW FROM OPERATING ACTIVITIES
Income before income tax
3,523,116
Adjustments for:
Impairment losses
592,244
Depreciation and amortization
659,530
Equity in net income of associates
(2,496)
Dividend income
(125)
Interest income
(9,784,138)
Interest received
11,966,600
Interest expense
3,145,089
Interest paid
(3,848,903)
Operating income before changes in operating assets and
6,250,917
Changes in operating assets and liabilities
(Increase) decrease in:
Due from Bangko Sentral ng Pilipinas
13,558,194
Interbank loans receivable and securities purchased
2,774,536
Trading securities
(5,490,353)
Loans and advances
18,169,220
Assets held for sale
534,352
Assets attributable to insurance operations
(44,916)
Other resources
(2,665,641)
Increase (decrease) in:
Deposit liabilities
(115,771,472)
Due to Bangko Sentral ng Pilipinas and other bank
(982,059)
Manager's checks demand drafts outstanding
375,360
Accrued taxes, interest and other expenses
(774,563)
Liabilities attributable to insurance operations
(173,376)
Derivative financial instrument
13,198
Deferred credits and other liabilities
(1,197,034)
Net cash from operating activities before income tax
(85,423,636)
Income taxes paid
(1,177,500)
Net cash generated from operating activities
(86,601,135)
CASH FLOWS FROM INVESTING ACTIVITIES
(Increase) decrease in:
Available for sale securities
24,841,573
Held-to-maturity securities
(473,882)
Bank, premises, furniture, fixtures and equipment
(637,563)
Dividends received
125
Equity investments
(171,736)
Assets attributable to insurance operations
168,960
Investment property
20,202
Net cash used in investing activities
23,747,679
CASH FLOWS FROM FINANCING ACTIVITIES
Cash Dividends
Increase (decrease) in bills payable
1,551,635
Net cash (used in) provided by financing activities
1,551,635
NET INCREASE (DECREASE) IN CASH
(61,301,821)
AND CASH EQUIVALENTS
CASH AND CASH EQUIVALENTS
January 1
161,910,429
December 31
100,608,608
2010
3,472,166
623,786
613,716
2,459
(24,333)
(8,787,748)
10,362,441
2,971,789
(3,193,071)
6,041,205
3,350,000
20,214,826
12,505,001
9,256,901
205,233
233,587
(2,483,225)
(18,821,110)
(1,173,715)
(32,301)
(616,867)
(185,745)
139,234
(361,594)
28,271,429
(634,001)
27,637,427
5,118,745
(5,019,900)
(462,048)
24,333
(123,938)
(41,957)
15,607
(489,158)
(2,922,079)
(7,391,223)
(10,313,302)
16,834,967
75,428,358
92,263,325
Page 8 of 16
NOTES TO FINANCIAL STATEMENTS
MARCH 31, 2011
SEC REQUIREMENT
Disclosure that the issuer’s interim financial
report is in compliance with generally
accepted accounting principles
The following information, as a minimum,
should be disclosed in the notes to financial
statements, if material and if not disclosed
elsewhere in the interim financial report:
• A statement that the same accounting
policies and methods of computation are
followed in the interim financial
statements as compared with the most
recent annual financial statements or, if
those policies or methods have been
changed, a description of the nature and
effect of the change.
• Explanatory comments about the
seasonality or cyclicality of interim
operations
• The nature and amount of items
affecting assets, liabilities, equity, net
income, or cash flows that are unusual
because of their nature, size, or incidents
• The nature and amount of changes in
estimates of amounts reported in prior
interim periods of the current financial
year or changes in estimates of amounts
reported in prior financial years, if those
changes have a material effect in the
current interim period
• Issuances, repurchases, and repayments
of debt and equity securities
• Dividends paid (aggregate or per share)
separately for ordinary shares and other
shares
DISCLOSURE
The Bank’s interim financial statements have been
prepared in accordance with the Phil. Financial
Reporting Standards (PFRS) which includes
applicable PFRS, PAS (Phil. Accounting Standards)
and interpretations approved by the FRSC (Financial
Reporting Standards Council).
•
The Bank’s interim financial statements have
been prepared consistent with its most recent
annual financial statements as of December 31,
2010 which was in accordance with the PFRS
(Philippine Financial Reporting Standards)
adopted by the SEC.
•
Nothing to report
•
Nothing to report
•
In compliance with the PFRS, the Bank adopted
certain accounting and measurement methods in
2010. Those changes did not materially affect the
current interim period.
•
Nothing to report
•
Nothing to report
Page 9 of 16
NOTES TO FINANCIAL STATEMENTS
MARCH 31, 2010
•
•
•
•
•
SEC REQUIREMENT
Segment revenue and segment result for
business segments or geographical
segments, whichever is the issuer’s
primary basis of segment reporting.
(This shall be provided only if the issuer
is required to disclose segment
information in its annual financial
statements)
Material events subsequent to the end of
the interim period that have not been
reflected in the financial statements for
the interim period
The effect of changes in the composition
of the issuer during the interim period,
including
business
combinations,
acquisitions or disposal of subsidiaries
and
long-term
investments,
restructurings,
and
discontinuing
operations
Changes in contingent liabilities or
contingent assets since the last annual
balance sheet date
DISCLOSURE
•
Attached
•
Nothing to report
•
Nothing to report
•
Changes in contingent liabilities and contingent
assets are in the normal course of business and
are not anticipated to cause any material losses
from those commitments/ contingent liabilities.
Nothing to report
Existence of material contingencies and •
any other events or transactions that are
material to an understanding of the
current interim period.
Page 10 of 16
BANK OF THE PHILIPPINE ISLANDS
SEGMENT REPORT
For the Quarter Ended March 31, 2011
CONSUMER
BANKING
CORPORATE
BANKING
In P Mn
INVESTMENT
BANKING /
FINANCIAL
MARKETS
CORP / ELIM
TOTAL
Interest Income
5,828
1,845
1,819
(61)
9,431
Interest Expense
2,857
162
31
95
3,145
Net interest income
2,971
1,683
1,788
(156)
6,286
Impairment charge
330
260
0
2
592
Net interest income after impairment charge
2,641
1,423
1,788
(158)
5,694
Other Income, net
1,589
427
890
188
3,094
Total operating expenses
4,135
724
251
155
5,265
95
1,126
2,427
(125)
3,523
Operating profit
62
Share in net income of associates
607
Provision for Income Tax
2,855
Net Income
CONSUMER
BANKING
CORPORATE
BANKING
INVESTMENT
BANKING /
FINANCIAL
MARKETS
CORP / ELIM
TOTAL
Assets
244,560
239,086
255,603
21,578
760,827
Liabilities
628,245
19,307
21,070
9,267
677,889
Capex
118
462
3
107
690
Depreciation
294
223
3
140
660
Page 11 of 16
Item 2. Management Discussion and Analysis of Financial Condition and Results of
Operations
Financial Condition
Total resources as of end of first quarter 2011 stood at P760.8 billion, P117.3 billion or 13.4%
lower than December 2010’s level of P878.1 billion. The decrease was due to the decline in total
deposits by P115.8 billion or 16.1% to P604.0 billion owing to the P118.2 billion time deposits
maturities. Accrued taxes, interest and other expenses contracted by P1.5 billion or 28.9% on
payments of accrued interests on matured/redeemed time deposits and accrued yearend expenses.
Deferred credits and other liabilities likewise declined by P1.2 billion primarily on lower bills
purchased contra account. Due to Bangko Sentral ng Pilipinas (BSP) and other banks also
declined by P982 million or 49.1% on lower tax collections and foreign banks deposits.
Derivative financial liabilities were lower by P307 million on lower market valuation of swaps
and offshore non deliverable forwards. Bills payable, however, grew by P1.6 billion on increased
foreign currency interbank borrowings. Manager’s Checks and Demand Drafts Outstanding
also went up by P375 million on higher level of outstanding manager’s checks issued.
Total capital funds grew by P663 million. Surplus increased by P2.9 billion or 8.2% mainly due
to first quarter earnings, but was partially offset by the increase of P2.2 billion in accumulated
other comprehensive loss resulting from the market valuation of available for sale securities.
On the asset side, interbank loans receivable and securities purchased under agreements to
resell decreased by P45.6B to service the time deposit maturities. Due from BSP likewise
declined by P30.1 billion on lower statutory reserves on deposits and placements with the BSP
following the drop in deposits. Available for Sale Securities, net fell by P28.0 billion on reduced
government securities inventory as interest rates were initially expected to rise in the first quarter
of the year. Trading securities, on the other hand, increased by P5.5 billion as interest rates
movement showed signs of a reversal in the upward trend by March 2011. Derivative financial
assets were also lower by P320 million on lower market valuation of offshore non-deliverable
forwards.
Loans and advances, net also went down by P19.0 billion or 5.0% on payments of loans drawn in
the fourth quarter. Cash and Other Cash Items dropped by P4.1 billion on lower cash level
requirement relative to year-end. Other Resources, net was higher by P2.4 billion due to deferred
charges related to the acquisition of the trust and investment management business of ING Bank
Manila N.V. and increased prepaid expenses. Due from Other Banks also grew by P2.2 billion
on higher balances with foreign banks from proceeds of matured foreign currency securities.
Deferred income tax also grew by P571 million on lower valuation gains on available for sale
securities and derivative products.
Page 12 of 16
RESULTS OF OPERATIONS
For the Three Months ended March 31, 2011 and 2010
Net income for the first quarter of 2011 was P2.8 billion, P123 million or 4.5% higher than same
period last year of P2.7 billion. Total revenues increased by P476 million but were almost negated
by an increase of P456 million in other expenses. Provision for income tax however declined by
P104 million.
Net interest income was up by P802 million or 14.6% due to the P81.0 billion or 11.7% average
asset base expansion, and the 8 basis points increase in net interest margins. Asset yield was
preserved at last year’s level, as 59.6% of the increase in asset base was in the relatively higher
yielding loans. Cost of funds likewise declined on the higher growth rate of low cost funds.
Interest income was up by P975 million while interest expense increased by P173 million.
•
The higher interest income was brought about by an overall improvement in the
volume of interest-bearing assets. Income on loans and advances was higher by P359
million or 6%, notwithstanding a drop in yield, on increased volume of P46.3 billion or
14.8%. Income on available for sale securities, held-to-maturity securities, and
deposits with BSP and other banks rose by P339 million, P185 million, and P67
million on higher average balances of P26.2 billion, P17.3 billion, and P16.9 billion,
respectively. The increase in income on trading securities of P47 million however
came from the 3% improvement in yield as its average volume dropped by P29.4
billion. These increases caused gross receipts tax to be higher by P21 million.
•
The interest expense increase was mainly attributed to the P239 million rise in interest
expense on deposits as average deposit volume grew by P66.4 billion. On the other
hand, interest expense on bills payable and other borrowings declined by P66.1
million due to the lower rediscounting volume with the BSP.
Other income was at P3.1 billion, P326 million or 9.5% lower than same period last year.
Trading gain (loss) on securities fell by P342 million on valuation losses on local government
securities in the trading book. Other operating income was also down by P227 million mainly
due to last year’s non-recurring access fee of P232 million from Philamlife. Income from foreign
exchange trading likewise dropped by P142 million on lower realized gains from forwards and
swaps. On the other hand, fees and commissions grew by P217 million on increased service
charges from higher transaction volume. Income attributable to insurance operations likewise
increased by P114 million on higher premiums earned by BPI/MS Insurance Corp. (BPI/MS) and
investment income at BPI Philam Life Assurance Co. With the overall decline in other income,
gross receipt tax declined by P54M.
Page 13 of 16
Impairment losses at P592 million was P31 million or 5.1% lower due to collection of interest on
some past due accounts, thereby necessitating the reversal of loss provision on the corresponding
accrued interest receivable.
Other expenses at P5.3 billion was P456 million or 9.5% higher than last year’s P4.8 billion.
Compensation and fringe benefits were higher by P217 million on increased manpower
headcount and higher salaries. Other operating expenses also reflected a P176 million or 13.8%
increase due to higher regulatory and variable costs.
Provision for income tax at P606 million was P104 million or 14.7% lower in view of the lower
taxable position of the Bank. This is reflected in the lower deferred income tax (DIT) of P143
million compared to last year which reflected the corresponding reversal of DIT equivalent to the
utilized portion of net operating loss carry over. Current income tax on the other hand increased
by P38 million due to higher final taxes.
Income attributable to non-controlling interest went up by P33 million or 111.9% largely on
increased earnings of BPI/MS.
Comprehensive Income
Total comprehensive income for the first quarter of 2011 was P663 million, P2.9 billion less than
last year’s P3.6 billion. The decline was due to the drop in other comprehensive income by P3.1
billion.
The net change in fair value reserve on available-for-sale securities was a P2.1 billion loss
based on the market valuation of bank’s available for sale securities. The share in other
comprehensive income of associates was likewise P1.1 billion lower based on the market
valuation of the investments of BPI-Philam. The fair value reserve on investments of insurance
subsidiaries also fell by P220 million due to the decline in the market valuation of equities and
funds of the insurance subsidiaries. Currency translation differences, however, improved by
P200 million due to the strengthening of the British pound.
With the above movements in other comprehensive income, income attributable to equity
holders similarly dropped by P2.9 billion while income attributable to non-controlling interest
managed to increase by P4.2 million with the higher profits of the bank’s insurance subsidiaries.
Page 14 of 16
Key Performance Indicators
The following ratios, applied on a consolidated basis, are used to assess the performance of the
Bank and its majority owned subsidiaries:
March 31, 2011
March 31, 2010
Return on Equity (%)
14.4
16.6
Return on Assets (%)
1.5
1.6
Net Interest Margin (%)
3.7
3.6
Operating Efficiency Ratio (%)
56.0
54.0
Capital Adequacy Ratio (%)-Basel II
16.5
14.7
Return on equity (ROE), net income divided by average equity, and return on assets (ROA), net
income divided by average assets, were lower by 222 and 10 basis points, respectively, largely due
to 21% and 12% increase in average equity and assets, respectively, as against the modest growth
in profits of 4%. ROE and ROA measure the bank’s efficiency in utilizing its capital and
resources, respectively, to generate profits.
Net interest margin (NIM), net interest income divided by average interest bearing assets, was 8
basis points higher this year as cost of funds declined by 9 basis points.
Operating efficiency ratio (cost to income), operating expenses divided by total revenues,
deteriorated by 2.0% to 56.0% as operating expenses growth outpaced operating the revenue growth.
The Bank thus utilized a higher level of expenses but fell short of generating more revenues.
Capital adequacy ratio (CAR), total qualifying capital divided by total risk-weighted assets,
measures the ability of the bank’s capital funds to cover its various risks. The bank’s CAR at
16.5% was better than last year’s 14.7% due to the increase in qualifying capital on account of the
stock rights issue and higher surplus. The bank’s CAR is above BSP’s minimum requirement of
10%.
Page 15 of 16
Material Events and Uncertainties
The Bank has nothing to report on the following:
1. Any known trends or any known demands, commitments, events or uncertainties that will
result in or that are reasonably likely to result in the registrant’s liquidity increasing or
decreasing in any material way.
2. Any events that will trigger direct or contingent financial obligation that is material to the
company, including any default or acceleration of an obligation.
3. Other material off-balance sheet transactions, arrangements, obligations (including contingent
obligations), and other relationships of the company with unconsolidated entities or other
persons created during the reporting period other than those mentioned above.
4. Material commitments for capital expenditures.
5. Any known trends, events or uncertainties that have had or that are reasonably expected to
have a material favorable or unfavorable impact on net sales or revenues or income from
continuing operations.
6. Events that will cause material change in the relationship between costs and revenues (such as
known future increases in cost of labor or materials or price increases or inventory
adjustments).
7. Any significant elements of income or loss that did not arise from the registrant’s continuing
operations.
8. Any seasonal aspects that had a material effect on the financial condition or results of
operations.
BPI UNIBANK
CONSOLIDATED AGING OF ACCOUNTS RECEIVABLE
MARCH 31, 2011
Amount
(In Thousands)
No. of Days Outstanding
0-90
91-180
181-360
Over 360
Grand Total
Less: Allowance for Probable Losses
Net of Allowance for Probable Losses
P
581,221
49,663
25,079
1,264,341
-------------------------P
1,920,304
1,017,014
-------------------------P
903,290
===============
© Copyright 2025

