CHM 152LL: Acid – Base Titration Curves Using a pH... Introduction
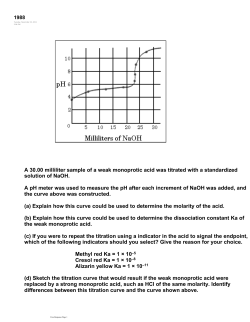
CHM 152LL: Acid – Base Titration Curves Using a pH Meter Introduction In this experiment you will use a pH sensor connected to a computer to generate titration curves. You will investigate two types of acid-base titration systems: one involving the titration of a strong acid by a strong base, and the other involving the titration of a weak acid by a strong base. A plot of the pH vs. the volume of titrant (solution in the burette) added shows how the pH of a solution changes as an acid, or base, is added. While performing these titrations you will be able to view the titration curves on the screen of the computer, and you will print out these curves after all of the data has been collected. One objective of this lab is to examine features of a strong acid-strong base titration curve and a weak acidstrong base titration curve. You will also learn how to estimate the pKa and the Ka for a weak acid from its titration curve. You will obtain titration curves for the following combinations of acids and bases (Exact concentrations will be labeled on the reagent bottles and should be written in your lab notebook): 1) hydrochloric acid, HCl(aq), with sodium hydroxide, NaOH(aq); 2) acetic acid, CH3COOH(aq), with sodium hydroxide, NaOH(aq). Equations and Explanations In an acid-base neutralization reaction, an acid reacts with a base to produce a salt and water: HA(aq) + MOH(aq) MA(aq) + H2O(l) Acid Base Equation 1 Salt At the equivalence point for an acid-base neutralization reaction, the amount of base added is equal to the amount of acid initially present; thus, the acid has been completely neutralized. The point in a titration where the indicator changes color is called the endpoint. An indicator is selected so that the color change will occur as close to the equivalence point as possible. For a given acid-base titration, a suitable indicator changes color over a pH range that coincides with the portion of the curve near the equivalence point where the pH rises sharply. When a weak acid solution is initially present, the following ionization reaction will occur: HA(aq) H+(aq) + A-(aq) Equation 2 The equilibrium constant for the ionization of the acid, Ka, is: Ka = [H ][A ] [HA ] Equation 3 At the volume half-way to the equivalence point during the titration of a weak acid by a strong base, onehalf of the weak acid, HA, has been converted to its conjugate base, A-. Thus, at this half-equivalence point, the concentration of the excess acid equals the concentration of the conjugate base formed, [HA] = [A-]. Equation 3 then simplifies to become: K a [H ][ A ] [H ] [HA ] Equation 4 Equation 4 can be written in logarithmic form by taking the negative logs of both sides: pKa = pH but only if [HA] = [A-] Equation 5 The equivalence point occurs at the midpoint of the region where the pH rises rapidly. The pKa can be determined by estimating the pH at the volume point halfway to the equivalence point. GCC CHM 152LL: Acid-Base Titration Curves Using a pH Meter page 1 of 5 Figure 1 shows a typical titration curve for the titration of a weak acid by NaOH (with labeled x and y axes). Figure 1. Acid-Base Titration curve for WEAK monoprotic acid. To perform the experiment, a computer-interfaced pH sensor will be placed in the the acid solution. You will use the computer to monitor pH as you titrate, and you will enter the corresponding values for the mL of NaOH added. You will need to generate enough data points to obtain a smooth curve. In some regions of the titration, the pH changes very slowly, and you can add larger increments of base at a time. Near the equivalence point, the pH changes very quickly, and you will need to add single drops of base at a time. Procedure Caution: Sodium hydroxide will attack your skin and is very effective at destroying the tissue of the eyeballs. Make sure you are wearing your goggles at all times and that you rinse off any sodium hydroxide immediately! Work in groups of 2-3 students. 1. Obtain the following approximate volumes of the standardized solutions in separate beakers: 15 mL of HCl(aq), 15 mL of CH3COOH(aq), and 50 mL of NaOH(aq). Record the concentrations of the HCl, CH3COOH and NaOH solutions in your laboratory notebook and lab report! 2. Calculate the volume of base needed for both titrations and show your professor the answers. Note: you should assume that 10.00 mL of acid is present for each titration since that is the amount you pipet into the titration beaker. 3. Obtain a magnetic stir plate, and attach a buret clamp to the vertical bar on the stir plate. Clean and rinse a buret with a few mL of the NaOH, and secure the buret with the buret clamp. Fill the buret a little above the 0.00-mL mark with the NaOH solution. Drain a small amount of the NaOH solution into your waste beaker so it fills the buret tip and leaves the NaOH at the 0.00-mL level of the buret. 4. Measure 50 mL of deionized water with a graduated cylinder and pour into a 250 mL beaker. Pipet 10.00 mL of the standardized HCl solution into the beaker and add 2-3 drops of phenolphthalein indicator. Place the beaker on the center of the magnetic stirrer, and adjust the position of the buret above the beaker. 5. Obtain and assemble the computer and LabPro system. Attach the pH sensor to the CH 1 outlet on the LabPro unit. Allow some space between your titration equipment and the computer! 6. To access the experiment file, double-click on the “Shortcut to GCC Chm Labpro” folder on the desktop. Open the “HCl titration curve” file. Check the set up on the screen. The vertical axis of GCC CHM 152LL: Acid-Base Titration Curves Using a pH Meter page 2 of 5 the plot should have pH scaled from 0 to 14 pH units. The horizontal axis should have volume scaled from 0 to 15 mL. (If the screen does not look like this, make sure the pH sensor is connected to LabPro, and the LabPro unit is plugged into a power strip that is turned on, then close and reopen the experiment file.) 7. Rinse the pH sensor with distilled water from a wash bottle and dry gently. Place the sensor in the pH 7 buffer solution. If the pH reading is 6.9-7.1, go to step 8. If the pH reading does not fall in this range, calibrate the sensor using the directions below. From the “Experiment” menu select “Calibrate” ► CH1: pH. When the calibration window opens, click on “Calibrate Now”. First calibration point A. Rinse the sensor with deionized water, and place it in the pH 4 buffer. B. Type “4” in the box below “Reading 1”. C. Swirl the sensor, wait until the voltage for Reading 1 stabilizes, and then click “Keep”. Second Calibration point 1. Rinse the sensor with deionized water, and place it in the pH 7 buffer. 2. Type “7” in the box below “Reading 2”. 3. Swirl the sensor, and wait until the voltage for Reading 2 stabilizes. Click “Keep”, and then click “Done”. Note: The storage solution is a special buffer solution to preserve the probe. If the solution is spilled, notify the instructor to have the bottle refilled. Do not pour water or any other solution into the sensor container! 8. Clamp the pH sensor above the acid solution using a 3 finger clamp. Lower the pH sensor into the acid solution, and adjust its position towards the side of the beaker, so that the sensor does not come into contact with the stirring bar. Begin stirring at a medium rate. Note: Stirring too rapidly could create a vortex around the sensor and possibly affect your pH measurements. 9. You are now ready to collect data for the titration curve – you will need to collect 30-40 data points for a good graph. This process goes faster if one person manipulates and reads the buret while another person operates the computer and enters volumes. All of the students should also record the pH and volume readings in their lab notebooks during data collection. Record and enter the volume readings to the nearest 0.01 mL. 10. Before adding any NaOH, click “Collect” and monitor the pH for 5-10 seconds. Once the pH reading has stabilized, click the “Keep” button (top right corner). An “Events with Entry” window opens. In the volume box, type “0” (for 0 mL). Click “OK”. 11. Add approximately 1 mL of NaOH titrant. When the pH stops rising, again click the “Keep” button. (The pH readings may fluctuate; unless you are near the equivalence point, you can click “Keep” about 20-30 secs after adding NaOH.) In the volume box, type the current buret reading, to the nearest 0.01 mL, and click “OK”. You will continue adding NaOH solution in 1 ml increments, clicking “Keep” to store the pH and buret readings after each increment of NaOH added until the pH changes by more than 0.3 units between 2 readings. 12. When the pH changes by more than 0.3 units between 2 readings, reduce the increment size to a few drops of NaOH. Click “Keep” to enter a new buret reading after each increment. Cut the increment size down to single drops near the equivalence point. You should wait longer for the pH to stabilize for readings close to the equivalence point. Make sure you record the mL of NaOH and the pH corresponding to the appearance of the first faint pink of phenolphthalein that lasts for at least one minute. Continue to add NaOH and enter volume readings after the endpoint. GCC CHM 152LL: Acid-Base Titration Curves Using a pH Meter page 3 of 5 13. When pH changes by less than 0.3 units between 2 readings, you can change back to adding the larger 1 mL NaOH increments, making sure to enter the volume after each addition. Continue adding 1 mL increments of NaOH solution and enter the volume after each addition until you’ve added 15 mL of NaOH. 14. When you have finished collecting data, click the “Stop” button. Have your instructor approve your graph before printing. 15. To print out copies of the HCl titration curve, go to the “File” menu, select “Print Graph”, enter your names in the footer box, and click “OK”. When the “Print” window opens, click on “Properties” (to the right of PS-149), and select the Layout tab at the top. Select the “Landscape” orientation. 16. To print out copies of the data table, go to the “File” menu, select “Print Data Table”, and click “OK” . After you verify that the graphs and tables printed out correctly, go to the “File” menu and select “Exit”. 17. From the “GCC Chem LabPro” folder, double-click to open “Acetic Acid Titration curve”. Refill the buret with NaOH and adjust the level of NaOH so that is initially at 0.00 mL. Refer to steps 4 and 8-14 and substitute CH3COOH for HCl to collect data for the second titration. For the CH3COOH(aq) titration, the pH may initially change by more than 0.3 units for the 1st two mL of NaOH added, but should level out in the buffer region. 18. When you are done with the pH sensor, rinse it with deionized water and place it in the sensor storage container. 19. Let your instructor approve your graph again before printing. Print copies of the Acetic Acid titration curve in the landscape orientation using the instructions from step 15. 20. Print copies of the Acetic Acid data table referring to step 16. 21. After you verify that the graphs and tables printed out correctly for both titration curves, go to the “File” menu and select “Exit”. Make sure to shut down computer. 22. The equivalence point occurs at the exact middle of the region where the pH rises sharply. Chances are there is no data point exactly at the equivalence point so it must be found graphically. Using a ruler and a pencil draw straight lines at the top and bottom of the the titration curve (dotted lines) as shown in Figure 1. The equivalence point occurs at the middle of the vertical line between the top and bottom lines you drew. Measure the distance between the top and bottom lines (parallel to the y-axis, not your graph) then divide by 2 to find the exact middle of the vertical line – don’t eyeball it! Make sure the distance from your equivalence point to the bottom line equals the distance from the equivalence point to the top line. Refer to your graphs and data tables to estimate the volume and the pH at the equivalence point for both curves. Mark the equivalence point, and write the corresponding pH numerical value and the actual volume in mL of the equivalence point on both of your curves. 23. For the acetic acid plot, locate and mark the half-equivalence point, and write the corresponding volume in mL and the estimated pKa value on the weak acid curve. Refer to Figure 1 on page 2 for an example. Waste Disposal: Discard the neutralized titration solutions in the sink with plenty of water. GCC CHM 152LL: Acid-Base Titration Curves Using a pH Meter page 4 of 5 Group Formal Lab Report – All sections of this report must be typed – except calculations for questions 5-8! The graphs you printed in lab should also be written on to show appropriate results. 1. Purpose: in complete sentences 2. All data from both titrations including all solution concentrations. 3. Both graphs appropriately marked (see figure 1 on page 2). You may write on these graphs! HCl: Mark the equivalence point, eq. pt. volume, and eq. pt. pH. CH3COOH: Mark the equivalence point, eq. pt. pH, eq. pt. volume. Also mark the half-equivalence point, its corresponding volume in mL and estimated pH/pKa value. 4. Results – Type the numerical values for the following in a summary table: Volume of NaOH and pH at the equivalence point for the hydrochloric acid curve Volume of NaOH and pH at the equivalence point for the acetic acid curve Volume of NaOH at the ½ equivalence point and pKa for acetic acid curve 5. Questions (below): Make sure you answer the questions thoroughly enough that your instructor knows which question you are answering. Calculations (questions 5-8) may be neatly hand-written on notebook paper or in your lab notebook, but questions 1-4 should be typewritten. 6. Conclusion (typed) – summarize the findings of the experiment. Remember to address the purpose of the experiment to state your conclusions. Give 3 possible sources of error AND discuss exactly how they affected your results. 7. Graded prelab notebook page for each member in the group. Questions for Lab Report 1. A student obtained a wet buret from the cart but failed to rinse it with a small amount of the base before starting a titration. Will more or less titrant (base) be required to neutralize the acid? Explain your answer. 2. Compare the initial pH values for both titrations. Explain why the pH of the HCl(aq) solution is initially lower, higher, or approximately equal to the pH of the CH3COOH(aq) solution. 3. What is the pH at the equivalence point for your HCl(aq)-NaOH(aq) titration curve? What is the pH at the equivalence point for your CH3COOH(aq)-NaOH(aq) titration curve? For each titration, explain why the pH at the equivalence point is either acidic, basic, or neutral by indicating which substances are present in solution that result in the observed pH. 4. Compare the final pH for the HCl(aq) and CH3COOH(aq) titration curves. Explain why this region is similar or different for the two acids. 5. a. Using the estimated pKa value from your acetic acid-sodium hydroxide curve, show your calculation of the experimental Ka value for acetic acid. b. Given the theoretical Ka value for CH3COOH(aq) is 1.8 x10⁻⁵, calculate the absolute percentage difference between the experimental and theoretical values using the equation below: Absolute % difference = experimental K a theoretical K a theoretical K a 100% 6. Calculate the volume of 0.125 M NaOH needed to neutralize 25.00 mL of 0.100 M HCl. Include a balanced chemical equation in your answer. 7. Calculate the pH at each point for the titration of 25.00 mL of 0.100 M HCl with the following volumes of 0.125 M NaOH: a. 0.00 mL b. 10.00 mL c. 20.00 mL d. 30.00 mL 8. Calculate the pH at each point for the titration of 25.00 mL of 0.100 M ascorbic acid (C6H8O6) (Ka = 8.0 x 10⁻⁵) with the following volumes of 0.125 M NaOH: a. 0.00 mL b. 10.00 mL c. 20.00 mL d. 30.00 mL GCC CHM 152LL: Acid-Base Titration Curves Using a pH Meter page 5 of 5
© Copyright 2025


