Quarterly Holdings - Lazard Asset Management
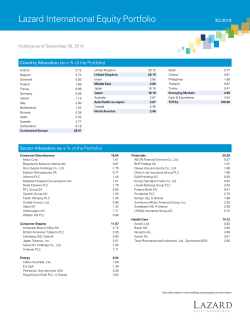
Lazard International Equity Portfolio
4Q 2014
Holdings as of December 31, 2014
Country Allocation (as a % of the Portfolio)
Austria
0.69
Belgium
2.80
Denmark
0.74
Finland
1.85
France
7.11
Germany
4.42
Ireland
1.21
Italy
2.25
Netherlands
3.72
Spain
Sweden
Switzerland
Continental Europe
2.16
3.87
7.72
38.53
United Kingdom
United Kingdom
Israel
Middle East
Japan
Japan
Australia
Asia-Pacific ex-Japan
Canada
North America
26.68
26.68
3.04
3.04
17.66
17.66
2.72
2.72
2.85
2.85
Brazil
Greece
Philippines
Taiwan
Thailand
Turkey
Emerging Markets
Cash & Equivalents
TOTAL
0.66
0.81
1.14
1.66
0.84
0.98
6.09
2.42
100.00
Sector Allocation (as a % of the Portfolio)
Consumer Discretionary
Asics Corp.
Bayerische Motoren Werke AG
Don Quijote Holdings Co., Ltd.
Estacio Participacoes SA
Informa PLC
Mediaset Espana Comunicacion SA
Reed Elsevier PLC
RTL Group SA
Swatch Group AG
Taylor Wimpey PLC
United Arrows, Ltd.
Valeo SA
William Hill PLC
Wolters Kluwer NV
16.63
0.55
0.89
2.18
0.66
1.59
1.11
1.94
0.62
0.98
1.45
0.74
1.50
0.94
1.48
Consumer Staples
Anheuser-Busch InBev NV
British American Tobacco PLC
Carlsberg A/S, Class B
Japan Tobacco, Inc.
Seven & I Holdings Co., Ltd.
Unilever PLC
9.46
2.80
2.21
0.74
1.06
1.46
1.18
Energy
Caltex Australia, Ltd.
Royal Dutch Shell PLC, A Shares
4.11
1.00
3.10
Financials
AEON Financial Service Co., Ltd.
Azimut Holding SpA
BNP Paribas SA
Daiwa House Industry Co., Ltd.
Direct Line Insurance Group PLC
GAM Holding AG
Krung Thai Bank Public Co. Ltd.
Lloyds Banking Group PLC
Piraeus Bank SA
Provident Financial PLC
Prudential PLC
Sampo Oyj, A Shares
Sumitomo Mitsui Financial Group, Inc.
Swedbank AB, A Shares
UNIQA Insurance Group AG
21.64
0.53
0.81
1.88
2.13
1.13
0.74
0.84
2.46
0.54
1.03
2.84
1.85
2.07
2.11
0.69
Health Care
Ansell, Ltd.
Bayer AG
Novartis AG
Shire PLC
Teva Pharmaceutical Industries, Ltd. Sponsored ADR
12.97
0.89
2.91
4.52
1.61
3.04
See other side for more holdings and prospectus information
Lazard International Equity Portfolio
4Q 2014
Holdings as of December 31, 2014
Sector Allocation (as a % of the Portfolio) – Continued
Industrials
Airbus Group NV
Alliance Global Group, Inc.
Assa Abloy AB, Class B
Atlantia SpA
Daikin Industries, Ltd.
International Consolidated Airlines Group SA
MacDonald Dettwiler & Associates, Ltd.
Makita Corp.
Rolls-Royce Holdings PLC
Ryanair Holdings PLC Sponsored ADR
Information Technology
Cap Gemini SA
NXP Semiconductor NV
Taiwan Semiconductor Manufacturing Co., Ltd.
Sponsored ADR
14.05
1.16
1.14
1.76
1.44
1.91
1.57
1.40
0.71
0.75
1.21
4.53
1.57
1.30
1.66
Materials
Anglo American PLC
Glencore PLC
James Hardie Industries PLC
Rexam PLC
KDDI Corp.
Rogers Communications, Inc., Class B
5.18
0.98
1.49
0.82
1.89
2.41
1.38
Telecom Services
Hellenic Telecommunications Organization SA
KDDI Corp.
Koninklijke KPN NV
Rogers Communications, Inc., Class B
SoftBank Corp.
Turkcell Iletisim Hizmetleri AS
7.97
0.27
2.66
0.94
1.45
1.67
0.98
Utilities
Red Electrica Corporacion SA
1.04
1.04
Cash & Equivalents
2.42
TOTAL
100.00
Published on January 21, 2015.
Equity securities will fluctuate in price; the value of your investment will thus fluctuate, and this may result in a loss. Securities in certain non-domestic countries may be less liquid, more
volatile, and less subject to governmental supervision than in one’s home market. The values of these securities may be affected by changes in currency rates, application of a country’s
specific tax laws, changes in government administration, and economic and monetary policy. Small- and mid-capitalization stocks may be subject to higher degrees of risk, their earnings
may be less predictable, their prices more volatile, and their liquidity less than that of large-capitalization or more established companies’ securities. Emerging market securities carry
special risks, such as less developed or less efficient trading markets, a lack of company information, and differing auditing and legal standards. The securities markets of emerging market
countries can be extremely volatile; performance can also be influenced by political, social, and economic factors affecting companies in emerging market countries.
The portfolio invests in stocks believed by Lazard to be undervalued, but that may not realize their perceived value for extended periods of time or may never realize their perceived value.
The stocks in which the portfolio invests may respond differently to market and other developments than other types of stocks.
The securities mentioned are not necessarily held by Lazard for all client portfolios, and their mention should not be considered a recommendation or solicitation to purchase or sell these
securities. It should not be assumed that any investment in these securities was, or will prove to be, profitable, or that the investment decisions we make in the future will be profitable or
equal to the investment performance of securities referenced herein. There is no assurance that any securities referenced herein are currently held in the portfolio or that securities sold
have not been repurchased. The securities mentioned may not represent the entire portfolio.
Not a deposit. May lose value. Not guaranteed by any bank. Not FDIC insured. Not insured by any government agency.
Please consider a fund’s investment objectives, risks, charges, and expenses carefully before investing. For more complete information about
The Lazard Funds, Inc. and current performance, you may obtain a prospectus or summary prospectus by calling 800-823-6300 or going to
www.LazardNet.com. Read the prospectus or summary prospectus carefully before you invest. The prospectus and summary prospectus
contain investment objectives, risks, charges, expenses, and other information about the Portfolio and The Lazard Funds that may not be
detailed in this document. The Lazard Funds are distributed by Lazard Asset Management Securities LLC.
Lazard Asset Management LLC • 30 Rockefeller Plaza • New York, NY 10112 • www.lazardnet.com
MF12384
© Copyright 2025
