
- Journal of Oral and Maxillofacial Surgery
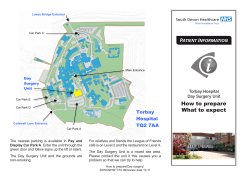
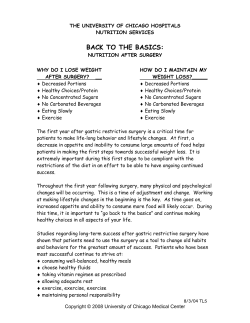
J Oral Maxillofac Surg 70:e553-e562, 2012 A More Accurate Method of Predicting Soft Tissue Changes After Mandibular Setback Surgery Hee-Yeon Suh, BS, DDS,* Shin-Jae Lee, DDS, MS, PhD, PhD,† Yun-Sik Lee, BS, DDS, MS,‡ Richard E. Donatelli, DMD, MS,§ Timothy T. Wheeler, DMD, MS, PhD,储 Soo-Hwan Kim, BS, MS,¶ Soo-Heang Eo, BS, MS,# and Byoung-Moo Seo, DDS, MS, PhD** Purpose: To propose a more accurate method to predict the soft tissue changes after orthognathic surgery. Patients and Methods: The subjects included 69 patients who had undergone surgical correction of Class III mandibular prognathism by mandibular setback. Two multivariate methods of forming prediction equations were examined using 134 predictor and 36 soft tissue response variables: the ordinary least-squares (OLS) and the partial least-squares (PLS) methods. After fitting the equation, the bias and a mean absolute prediction error were calculated. To evaluate the predictive performance of the prediction equations, a 10-fold cross-validation method was used. Results: The multivariate PLS method showed significantly better predictive performance than the conventional OLS method. The bias pattern was more favorable and the absolute prediction accuracy was significantly better with the PLS method than with the OLS method. Conclusions: The multivariate PLS method was more satisfactory than the conventional OLS method in accurately predicting the soft tissue profile change after Class III mandibular setback surgery. © 2012 American Association of Oral and Maxillofacial Surgeons J Oral Maxillofac Surg 70:e553-e562, 2012 The soft tissue profile does not directly reflect the changes in the underlying skeletal structure during surgical-orthodontic treatment. Some parts of the soft tissue have shown strong associations with the changes in the underlying skeletal structures, but other parts have tended to be more independent of the changes in the skeletal structure.1 A frequently used guide to the expected soft tissue changes after surgery is expressed simply as the 1:1 correspon- dence ratio for a specific bone to soft tissue change.2-5 However, the ratio between the bone and soft tissue changes is extremely variable. Although certain trends persist, little of the data has been consistent across studies. Most have arrived, more or less, at different values and relationships. For example, the soft/hard tissue ratio range was reported to vary from 73%6 to 100%7,8 at the lower lip area, 59%9 to 128%10 at the soft tissue pogonion, *Graduate Student, Department of Orthodontics, Seoul National University School of Dentistry and Dental Research Institute, Seoul, Korea. †Professor and Chair, Department of Orthodontics, Seoul National University School of Dentistry and Dental Research Institute, Seoul, Korea. ‡Graduate Student, Department of Orthodontics, Seoul National University School of Dentistry and Dental Research Institute, Seoul, Korea. §Clinical Assistant Professor, Department of Orthodontics, University of Florida College of Dentistry, Gainesville, FL. 储Eminent Scholar and Chair, Department of Orthodontics, University of Florida College of Dentistry, Gainesville, FL. ¶Graduate Student, Department of Statistics, Korea University, Seoul, Korea. #Graduate Student, Department of Statistics, Korea University, Seoul, Korea. **Professor, Department of Oral and Maxillofacial Surgery, Seoul National University, Seoul, Korea. This work was supported by the Basic Science Research Program through the National Research Foundation of Korea (NRF) funded by the Ministry of Education, Science and Technology (grants 2011-0026594 and 2011-0028067). Address correspondence and reprint requests to Dr Lee: Department of Orthodontics, Seoul National University School of Dentistry and Dental Research Institute, 101 Daehakro, Jongro-Gu, Seoul 110-749 Korea; e-mail: nonext@snu.ac.kr © 2012 American Association of Oral and Maxillofacial Surgeons 0278-2391/12/7010-0$36.00/0 http://dx.doi.org/10.1016/j.joms.2012.06.187 e553 e554 PREDICTING SOFT TISSUE CHANGES AFTER MANDIBULAR SETBACK SURGERY and 90% to 112%2 at the mentolabial fold. However, these are still vague instructions and open to interpretation by clinicians.11 Other typical methods used as algorithms for commercial computer programs include correlation analysis and/or regression analysis, also referred to as the conventional ordinary least-squares (OLS) method.5,7,8,12-15 Each study used a limited number of variables. The mode of analyses was unidirectional and univariate. For example, after mandibular setback surgery, the soft tissue pogonion will change, not only in the anteroposterior dimension, but also in the vertical dimension, in response to the influence from vertical movement of the adjacent structures. Conventional univariate analysis will not reflect all these soft tissue changes induced by the skeletal alterations. To elaborate, a certain degree of vertical repositioning of the mandible induces anteroposterior relocation of the soft tissues. Likewise, anteroposterior skeletal changes frequently result in vertical changes in the soft tissues. These are indications that any soft tissue relocation would not be sufficiently represented only by the underlying bony reference points. To restate, the soft tissue response at a specific point after surgery is highly dependent on its adjacent points, and its neighboring points can be dependent upon each other. Therefore, to predict the soft tissue changes after surgery, the location of the adjacent points would likely provide a useful guide. Additional incorporation of other previously known factors, as much as possible, such as gender, age, interval after surgery, preoperative soft tissue thickness, and type of surgical procedures, might also increase the predictive accuracy. Computer programs attempting to predict the soft tissue changes after surgery have been greatly improved by graphics and user interfaces.16 All orthognathic surgical simulation software programs are based on either preprogrammed soft/hard tissue movement ratios derived from studies that reported the mean ratios of soft tissue to hard tissue movement5 or OLS equations that represent the database for manual and computerized surgical predictions.17,18 When using prediction software, a potential problem is that most software identifies only a limited number of soft tissue landmarks to digitize the profile. The soft tissue response is not that simple. Thus, the multivariate approach, which involves multiple predictor and multiple response variables simultaneously, is more appropriate. The multivariate prediction method developed rapidly with the advent of high-speed computers. The partial least-squares (PLS) method is a comparatively new method of constructing prediction equations. The basic ideas of PLS prediction methods were first developed in the field of economics and social sciences but mainly in chemometrics.19 For example, in chemometrics or bioinformatics, the number of predictor variables, p, far exceeds the number of observations, n. This is also termed a “small n large p situation.” In such cases, the OLS method is not suitable for meaningful and robust results.20 Because there are a number of variables to consider, including patient age and gender, interval after surgery, preoperative skeletal characteristics, pre-existing soft tissue thickness and position, amount of surgical replacement at various skeletal landmarks and direction, and so forth, the situation is almost the same for the soft tissue prediction after surgery. Currently, the PLS method has become an important tool in many scientific and technological applications with image analysis,19,21,22 biostatistics, and bioinformatics.23-25 The aim of the present study was to develop a multivariate method to predict the soft tissue changes after mandibular setback surgery. The specific research goals were to determine accurate and valid predictions and suggest the appropriateness of a multivariate PLS method compared with the conventional OLS method in determining multiple predictor and multiple response variables. The null hypothesis was that no difference would be found between the soft tissue prediction accuracy and validity produced by the PLS and conventional OLS methods. Patients and Methods SUBJECTS The subjects included 69 patients (43 women [average age 24 years, range 16 to 39] and 26 men [average age 23 years, range 19 to 30]) who had undergone surgical correction of a Class III mandibular prognathism by mandibular setback surgery. The subjects were selected from the patient files of the Seoul National University Dental Hospital. All subjects were of Korean ethnicity. The subjects were homogenous in terms of the surgical interventions, because a homogenous sample is required when investigating the soft tissue response to a specific orthognathic surgery.26 No patient included in the present study had a cleft lip and palate, an injury, or a severe type of asymmetry.27 No syndromic or medically compromised patients were included. No surgical intervention other than mandibular setback with or without genioplasty was performed. Genioplasty was accepted, because this is probably the most common adjunctive surgical procedure associated with mandibular setbacks when correction for chin projection is needed and/or patients have a flat or insufficient mentolabial contour. Those who had undergone conjunctive maxillary osteotomy procedures were excluded. All patients e555 SUH ET AL FIGURE 1. Diagram showing reference planes and cephalometric landmarks used in present study. A, Image composed from preoperative radiograph, with hard tissue landmarks given in capital letters. B, Soft tissue landmarks shown on the follow-up cephalogram and given in lowercase letters. Suh et al. Predicting Soft Tissue Changes After Mandibular Setback Surgery. J Oral Maxillofac Surg 2012. had been treated with fixed orthodontic appliances before and after surgery. During the preoperative orthodontic treatment, the incisor teeth were appropriately decompensated, and the arches were coordinated and stabilized. Postoperative orthodontic treatment was limited to completing the adjustment of the occlusion, and minimal incisor movement was required. The institutional review board for the protection of human subjects reviewed and approved the research protocol (institutional review board no. S-D 20110009). CEPHALOMETRICS Lateral cephalograms were taken before and after orthognathic surgery for all patients. During imaging, the patients held their teeth in occlusion with the lips relaxed. Preoperative lateral cephalograms were taken near the time of the surgical intervention. Follow-up cephalograms were taken at least 4 months (average 8.5) after surgery. All cephalograms were traced by the same examiner (H-Y S). To orientate a subject’s pre- and postoperative tracings to the same head position, the two tracings were superimposed on the anterior cranial base to confirm whether the sella-nasion planes were coincident. The anatomic tracing, cephalometric landmarks, soft tissue outline, and their abbreviations used in the study are illustrated in Figure 1. A total of 46 skeletal landmarks and 32 soft tissue landmarks from the glabella to the terminal point were identified. Capital letters were used to demarcate hard tissue landmarks (Fig 1A). Lowercase letters were used indicate the soft tissue landmarks (Fig 1B). With its origin at Sella, the vertical reference was established perpendicular to Sella-Nasion ⫹ 7°. SellaNasion is considered to be relatively stable beyond 7 years of age.28 The x coordinates represented the horizontal distance from the vertical axis and the y coordinates, the vertical distance from the horizontal axis measured in millimeters (Fig 1A). Using a custom digitizing program with Microsoft Visual C# 2010 (Microsoft, Redmond, WA), the coordinates of every landmark on each tracing were sequentially computed in relation to the x and y reference system. VARIABLES INCLUDED IN PREDICTOR AND RESPONSE MATRICES A total of 134 predictor variables (also termed the input, explanatory, descriptive, regressor, or independent variables, or the X matrix) were entered into the prediction equation. These included a total of four continuous variables: patient age and gender, interval e556 PREDICTING SOFT TISSUE CHANGES AFTER MANDIBULAR SETBACK SURGERY after surgery, and amount of mandibular asymmetry; two factor variables: type of mandibular surgery (bilateral sagittal split ramus osteotomy vs intraoral vertical-sagittal split ramus osteotomy29) and the use of genioplasty; 35 preoperative skeletal measurements; 40 preoperative soft tissue measurements and 25 preoperative soft tissue thickness variables; and 28 variables of surgical skeletal repositioning in the anteroposterior and vertical directions. The soft tissue changes in the 18 soft tissue landmarks in both the x and the y axes were included in the 36 response variables (also termed the output, regressand, or dependent variables, or the Y matrix). PROBLEM FORMULATION AND NOTATION The present study used bold capital letters for the matrices (e.g., X, size 69 (N)subjects ⴛ 134 (K)variables matrix of predictor variables and Y, size 69 (N)subjects ⴛ 36 (M)responses matrix of response variables); superscripts for transposed matrices (e.g., XT); bold, lowercase characters for vectors (e.g., x, xi, and ym); and italic, lowercase characters for scalars (e.g., s, pa, and xik). As a first step, we subtracted the means x k and y m, from the data xk and ym, where k ⫽ 1, . . ., K and m ⫽ 1, . . ., M, respectively, and then scaled each variable xk and ym to the unit variance. The resulting centered and normalized data were collected in the N ⫻ K matrix X and the N ⫻ M matrix Y. The centering makes the following computations numerically well conditioned.30 The normalization gives each variable equal influence in the initial stage of the data analysis. TWO MULTIVARIATE METHODS OF FORMING PREDICTION EQUATIONS Two multivariate methods of forming prediction equations were developed using 134 predictor and 36 response variables: the conventional OLS and PLS methods. OLS is the conventional multivariate linear regression method using forward variable selection coupled with the Akaike information criterion.31 The prediction equation using the OLS solution can be written as Y ⫽ XBOLS ⫹ E, where E is an N ⫻ M matrix of residual for Y, and BOLS is a K ⫻ M matrix solution of least squares, coefficients BOLS ⫽ (XTX)⫺1XTY using the multivariate Gauss-Markov theorem.32 The PLS prediction equation can be written as Y ⫽ XBPLS ⫹ F, where F is an N ⫻ M matrix of residual for Y, and BPLS is a K ⫻ M (size, 134 ⫻ 36) matrix of PLS prediction coefficients. In the equation itself, the PLS method resembles the stepwise OLS method; however, in contrast to the OLS method, it is applicable even if the variables are strongly intercorrelated (multicollinear), contain significant noise, and even if the number of variables is greater than the number of subjects (i.e., “small n large p situations”).33 All pre- dictors are included in the final solution; no variables have to be discarded, which is necessary in stepwise OLS. A variety of algorithms have been used for the PLS method. A more detailed algorithm for nonlinear iterative PLS is available from Lindberg et al,30 Wold et al,34 Geladi and Kowalski,35 and Höskuldsson.36 VALIDATION AND ERROR TEST FOR PREDICTION METHODS To evaluate the predictive performance of the prediction equations, the cross-validation method was used. The technique of cross-validation was also used to determine the best PLS components.37 After fitting the equation, the bias was calculated as the mean difference. The difference between the actual result and predicted position was calculated by subtracting the value for the predicted position from the actual position, mean (Yactual ⫺ Ypredicted). The criterion of goodness-of-fit was defined as the mean absolute prediction error, mean |Yactual ⫺ Ypredicted|. When developing a prediction method, typically, the model is fit for part of the data (the training set, also called the learning or study data set), and the quality of the fit is judged by how well it predicts the other part of the data (the test set, also termed the real, prediction, or validation data set). The basic idea of cross-validation is to randomly divide the data set N into L groups. Next, a reduced data set N⫺ is formed by deleting the first group. The parameters in the equation are estimated on the basis of the reduced data set and the given criterion of goodness-of-fit, a mean absolute prediction error in the present study. Using these parameter values and the equation, the predicted values are calculated for the objects in the deleted group. Finally, the data set N is restored by including the deleted group. Next, the second group of data is deleted, and the procedure is repeated for the new reduced data set, giving a second mean absolute prediction error. Then, the third group is deleted, and so on, until each object has been deleted once, and the prediction error for this object has been calculated.37 To compute the mean absolute prediction error in a test data set, a ten-fold cross-validation was used. In the cross-validation, each equation was estimated 10 times, each time removing one tenth of the subjects from the estimation in the training data set. Thus, every fold served for independent testing of the equation’s predictive ability. Therefore, the possibility of a mistaken interpretation of the equations caused by trivial, random measurement errors was greatly reduced.38 The language R (Vienna, Austria), a free software environment for statistical computing and the result of a collaborative effort with contributions worldwide, was used. It runs on a wide variety of Unix platforms, Windows, and Mac OS.39 Detailed codes of the multivariate e557 SUH ET AL Table 1. PATIENT CHARACTERISTICS Variable Age (yr) Female Male Interval after surgery (mo) Mandibular setback BSSRO IVSRO Genioplasty No Yes Asymmetry (mm) Mandible shift to right Mandible shift to left None Surgical repositioning at point B (mm) Anteroposterior repositioning Vertical repositioning Overjet before surgery (mm) Overbite before surgery (mm) Patients (n) Mean SD Minimum Maximum 43 26 24 23 8.5 5 3 2.7 16 19 3.7 39 30 14.6 2.2 2.3 0.0 0.8 ⫺6.9 ⫺2.7 ⫺6 0 3.4 4.0 3 2 ⫺15.0 ⫺14.9 ⫺11 ⫺4 0.2 7.0 1 4 43 26 52 17 19 22 28 Abbreviations: SD, standard deviation; BSSRO, bilateral sagittal split ramus osteotomy; IVSRO, intraoral vertical-sagittal split ramus osteotomy. Suh et al. Predicting Soft Tissue Changes After Mandibular Setback Surgery. J Oral Maxillofac Surg 2012. OLS, modified PLS, and validation algorithm for use with language R is available by request. Results The subject characteristics are listed in Table 1. The average interval after surgery was 8.5 months. A total of 17 patients underwent genioplasty. The average amount of surgical repositioning at point B was 7 mm posteriorly and 3 mm superiorly. The amount of surgical repositioning at point B was similar to the amount of overjet before surgery. This might have been because of the surgeons’ aim to produce occlusions with a normal overjet when repositioning the mandible during surgery.28 The derived prediction method was successfully cross-validated. After fitting the prediction equations in the training data set, errors (both bias and mean absolute error) were determined to be trivial to none using both the OLS and the PLS methods (data not shown). The result of the prediction errors after applying the prediction equations in the test data set from the 2 methods are summarized in Table 2. The soft tissue landmarks we included in Table 2 were chosen to concisely describe the validity and accuracy of the suggested soft tissue prediction method. After applying the prediction equations in the test data set, the bias did not show a significant difference between the two methods (second and third columns of Table 2). However, a comparison test using the mean values between the predicted and actual soft tissue profile might not have been appropriate; because underestimates and overestimates will cancel each other out, showing no significant difference between the mean values. Therefore, scattergrams and 95% confidence ellipses for several soft tissue landmarks were constructed to compare the bias (a mean difference) between the OLS and PLS methods (Fig 2). The ellipsoid satisfies (x ⫺ )T ⌺⫺1 (x ⫺ u) ⱕ 2(␣)2, where x is the 2-dimensional (x and y) vector for the bias; is the mean vector for x; ⌺ is the covariance matrix; and 2(␣)2 is the upper 95th percentile of a 2 distribution with 2 degrees of freedom, leading to contours that contain 95% of the probability.32 A negative value indicated the prediction was more posterior in the x axis or more superior in the y axis than the actual result. The size of the 95% confidence ellipses for the OLS method were significantly larger than those for the PLS method, showing superior predictive performance of the PLS method compared with the OLS method (Fig 2). Absolute prediction errors after applying the prediction equation in the test sample showed significant differences for all the soft tissue landmarks between the two methods. The PLS method showed a significantly more accurate and greater predictive performance than the conventional OLS method in all response variables (fifth and sixth columns in Table 2). Discussion The main motivation for the present study was the inaccuracy in soft tissue predictions when using com- e558 PREDICTING SOFT TISSUE CHANGES AFTER MANDIBULAR SETBACK SURGERY Table 2. COMPARISON OF SOFT TISSUE PREDICTION ERRORS BETWEEN CONVENTIONAL OLS AND PLS PREDICTION METHODS Bias Variable or Coordinate Horizontal (x value [mm]) Subnasale Superior labial sulcus Labrale superius Upper lip Stomion superior Stomion inferior Lower lip Labrale inferius Soft tissue B point Protuberance menti Pogonion Gnathion Menton R point Terminal point Vertical (y value [mm]) Subnasale Superior labial sulcus Labrale superius Upper lip Stomion superior Stomion inferior Lower lip Labrale inferius Soft tissue B point Protuberance menti Pogonion Gnathion Menton Mean Absolute Error OLS PLS P Value OLS PLS P Value* ⫺0.33 0.36 0.36 0.62 ⫺1.00 0.31 1.59 1.71 0.73 0.21 ⫺0.30 ⫺0.71 ⫺1.06 4.18 0.30 ⫺0.05 ⫺0.09 ⫺0.07 ⫺0.10 ⫺0.14 0.09 ⫺0.05 ⫺0.06 ⫺0.04 ⫺0.05 ⫺0.01 ⫺0.04 ⫺0.59 ⫺0.07 ⫺0.50 .347 .318 .474 .310 .542 .855 .090 .060 .252 .702 .757 .567 .871 .265 .858 1.77 2.67 3.46 4.14 8.42 7.10 5.99 6.08 4.24 4.10 5.30 7.13 17.32 21.62 26.85 0.95 1.39 1.76 1.90 2.25 2.60 2.20 1.92 1.10 1.36 2.42 1.97 6.11 9.65 11.10 ⬍ .001 ⬍ .001 ⬍ .001 ⬍ .001 ⬍ .001 ⬍ .001 ⬍ .001 ⬍ .001 ⬍ .001 ⬍ .001 ⬍ .001 ⬍ .001 ⬍ .001 ⬍ .001 ⬍ .001 0.14 ⫺0.99 0.42 0.09 1.19 0.11 2.20 0.16 ⫺0.84 ⫺1.26 ⫺1.55 ⫺1.16 ⫺0.21 ⫺0.02 ⫺0.01 0.12 0.05 0.05 0.04 ⫺0.03 ⫺0.16 ⫺0.09 ⫺0.04 0.08 0.02 0.07 .597 .385 .709 .968 .147 .934 .079 .825 .427 .282 .461 .378 .784 1.69 7.08 4.75 5.20 4.56 5.06 7.22 8.04 4.99 6.18 13.86 8.22 6.44 0.75 2.01 1.89 1.66 1.56 2.52 3.49 4.11 2.75 3.50 3.49 2.10 1.58 ⬍ .001 ⬍ .001 ⬍ .001 ⬍ .001 ⬍ .001 ⬍ .001 ⬍ .001 ⬍ .001 ⬍ .001 ⬍ .001 ⬍ .001 ⬍ .001 ⬍ .001 *P ⬍ .001, t test. Suh et al. Predicting Soft Tissue Changes After Mandibular Setback Surgery. J Oral Maxillofac Surg 2012. mercial computer simulation programs, such as the Dolphin Imaging System or Quick Ceph Studios. Although the programs have now been updated, it would appear that the prediction is still problematic, resulting in tissue tags, sharp angles, and omissions. If a soft tissue prediction method manages to measure changes perfectly, we would expect an accurate result. However, unexplainable individual variations are inevitably present; therefore, it is unrealistic to expect perfect predictions. Furthermore, the responses after surgery across patients are not constant. Perfect accuracy is not available in practicality, but some methods are more accurate than others. The PLS method in the present study demonstrated significantly more accurate predictions than the conventional OLS method (Table 2). The present study is the first attempt to apply the multivariate PLS method in dental research. Also, no other validation report for estimating soft tissue prediction after orthognathic surgery has been published in dental studies. From the clinical viewpoint, the validity of a prediction equation is the single most important factor influencing the usefulness of the prediction equation. It is necessary to identify the extent to which a prediction estimates the soft tissue change in groups of subjects other than those from which it was derived. The accuracy of test error in the test set is far more important than the training error or the goodness-offit of the prediction method in the training set from which the equation was developed, such as the simple or adjusted coefficient of determination (R2) in the OLS method. When the factors are few, are not significantly correlated, and have a well-understood relationship to the responses, a conventional analysis, such as OLS, can be a good method to turn the data into information. However, the OLS method assumes that all the predictor variables are independent, which is not the case, especially for the numerous dental and facial variables in the X and Y matrices. In practice, this e559 SUH ET AL FIGURE 2. Scattergrams and 95% confidence ellipses for bias obtained from OLS (red) and PLS (blue) prediction methods. Plots clearly indicate the bias in both x and y axes was greater in the OLS than in the PLS method. Application of the equations to individuals could result in errors to this extent in 95% probability. Suh et al. Predicting Soft Tissue Changes After Mandibular Setback Surgery. J Oral Maxillofac Surg 2012. condition is never exactly met. Additionally, when the number of predictors exceeds the number of observations, the likely result will be a model that fits the training data set perfectly but that will fail to predict the test data well. This phenomenon is termed overfitting.24 That the conventional OLS method fitted perfectly in the training data set but failed to predict the real data with enough accuracy was an evident example of the overfitting phenomenon (Table 2). This implies that conventional OLS methods are not satisfactory for high-dimensional data applications, because they are not capable of solving multicollinearity among the predictor and/or response variables. In such cases, although there are many manifest factors, there might be only a few underlying or latent factors (also termed components) that account for e560 PREDICTING SOFT TISSUE CHANGES AFTER MANDIBULAR SETBACK SURGERY most of the variation in the response. The goal of PLS is to extract these latent factors, accounting for as much of the manifest factor variation as possible, while modeling the response well.40 Although previous literature have reported that the main areas of inaccuracy were the lips,26 this was not the case in the present study. Instead, the R point and the terminal points were the main areas of inaccuracy. Increased accuracy along the lip areas might have been benefited from the increased number of soft tissue landmarks added in the present study. There was a number of sources of errors. Also, the 2-dimensional representation of a 3-dimensional change is subject to a certain degree of error. As anticipated, some degree of prediction error was inevitable. This arose early from changes in the defined points of the cephalometric tracings and superimpositions. For example, the preoperative hard tissue “Pogonion” is closely related to the soft tissue “pogonion”; however, after surgery, the new most anterior point on the contour of the soft tissue chin (soft tissue “pogonion”) might not reflect the original most anterior point of the soft tissue chin (soft tissue “pogonion”) owing to repositioning and rotation of the mandible.12 Therefore, the definitions themselves for several soft tissue landmarks might have contributed to the large prediction error in the x or y axes. For example, the foremost soft tissue landmark of the lower lip, soft tissue B point and pogonion, showed larger vertical, than anteroposterior, variation (Fig 2). Also, greater anteroposterior variation was observed in the absolute prediction error for the lowermost soft tissue landmark, the menton (Table 2). A larger variation in one axis than in another direction in some soft tissue landmarks, however, was thought to be tolerable for two reasons. First, in soft tissue rendering, some landmarks are used to determine only either the anteroposterior or vertical position. For example, the soft tissue pogonion is used to determine the foremost, x axis position. Second, because we added a number of soft tissue landmarks, the orientation of a certain point can be referred to the neighboring points. The following variables were included in the present study and were selected after reviewing the previously published data: age, gender, interval after surgery, upper lip, pre-existing soft tissue characteristics, lip thickness, additional soft tissue landmarks on the neck area, and genioplasty. In the present study, we only included patients with preoperative cephalometric radiographs recorded at a minimum age of 16 years for women and 19 years for men. By this age, circumpubertal growth is complete or almost complete.41 Thus, the possible confounding effects of facial growth in the analysis were minimized.42 Also, no evidence was found that growth affected the final result, because the analysis confirmed that patient age at the start of treatment did not influence the treatment outcome. Aging changes the soft tissue morphology, and the soft tissues are under the influence of the tension of the oral musculature and the amount of subcutaneous fat present at different ages.18 From 24 to 34 years of age, retrusion of the lips and posterior movement of the soft tissue pogonion have been reported.43 Because of aging, which results in a decrease in soft tissue strength, the soft tissue change one year after surgery would have mixed effects.6,44 We added the patient age and gender as predictor variables, which is one of the default design settings in biostatistics. The soft tissue responses vary over time, as indicated by how the soft to hard tissue correlations were strongest immediately after surgery and weaker later. Typically, the swelling caused by the surgery begins to resolve by 8 weeks and has fully resolved by 6 months.45 The facial morphology recovers to approximately 90% of the baseline within 3 months after surgery.46 Therefore, to ensure adequate soft tissue recovery after surgery, a follow-up period of at least 3 months seemed necessary; thus, we included the interval after surgery as a predictor variable. The present study included the changes in the upper lip position as response variables, although the patients did not undergo maxillary repositioning. Mandibular setback surgery alone can affect the upper lip in the horizontal and vertical directions, even without concomitant maxillary surgery. Mandibular setback surgery resulted in a decreased upper lip thickness.47 Most changes in the upper lip included lengthening and retrusion.15 This could have been caused by the resolution of the abnormal incisal relation before surgery.7,15,48 The anteroposterior and vertical changes were not separate but correlated. A greater mandibular setback also resulted in greater retrusion and lengthening of the upper lip.15 The soft tissue thickness should be included as a predictor variable. Also, the inclusion of the lip thickness in the prediction analysis is known to have substantially better power of explanation.12-14 Gjørup and Athanasiou48 indicated the operative changes in the upper lip thickness and associated them with the initial preoperative thickness of the area. Associations between the preoperative thickness of the upper and lower lips and the net change in thickness have been reported, revealing the greater the preoperative soft tissue thickness, the greater the expected change.8 The most significant area of prediction error was the neck. Mandibular setback leads to a compression of the soft tissue by shortening of mandibular bone length but with an unchanged soft tissue volume. This relative increase of soft tissue could lead to a double chin, a relative deepening of the mentolabial fold, a e561 SUH ET AL loss of tissue strength, and, as a result, premature aging of the face.7,18 The present study included the measurements in the R point and terminal point area to properly describe this type of soft tissue response. In addition, we added several arbitrary skeletal and soft tissue landmarks to ensure gentle curving contours in this area, which would also improve the accuracy of soft tissue rendering. The accuracy for predicting the R and terminal points, however, was beyond the clinically acceptable range (Table 2). This might have been in part because the soft tissue in the neck region is movable when taking a lateral cephalogram. When planning orthognathic surgery, genioplasty is a powerful adjunctive procedure to improve the facial profile. Previously, the addition of genioplasty was a confounding variable when predicting the soft tissue responses.17,18 Formerly, it was difficult to exactly determine the soft tissue changes specific to mandibular setback when other, simultaneous, orthognathic surgical procedures, such as a genioplasty, were included. However, the soft tissue movement after surgery should not merely be interpreted by the amount of surgical bony movement alone. For example, because the remodeling process causes bony deposition in the area, postgenioplasty surgery cases resulted in soft tissue responses caused by the remodeling of bone in the locations around Pogonion and Point B, as well in the vicinity of osteotomy lines.3 In addition, changes in the length of the facial muscles after their detachment during surgery can affect the soft tissue response. This induces relaxation of the musculature in the lip and chin areas, associated with a decrease in the anteroposterior and vertical dimension of the lower face.14 Therefore, in the present study, by allocating an extra number of soft and hard tissue landmarks at the chin area, we accounted for the type and direction of genioplasty when developing the soft tissue prediction. The PLS method seems to be more appropriate than conventional methods in predicting the soft tissue profile changes after surgery. Freed from the intercorrelation between those variables, the PLS soft tissue prediction method can include as many predictor variables as possible. It is hoped that this soft tissue prediction method will provide a practical algorithm for developing a surgical treatment simulation program. The method used in the present study might facilitate the additional development of soft tissue prediction algorithms for various surgical and orthodontic treatment objectives. Because the PLS prediction method does not depend on any expanded number of variables, it has two plausible advantages. First, the curves of a soft tissue outline can be rendered and smoothed by adding an increased number of soft tissue points, which would be more compati- ble with computer simulations. Second, although the present study lacked frontal morphology changes and ethnicity considerations, when additional information is provided, the method could be implemented to incorporate all the other meaningful variables. This would be an interesting topic for future studies. We hope that by using this method, additional dental data sets can be incorporated, with the goal of developing a comprehensive clinical predictive model for anticipating the effect of changes on an individual’s dentition and face. In conclusion, the changes in the soft tissue profile caused by surgical orthodontic treatment have distinct characteristics that cannot be calculated or easily described using a simple formula. The present study was intended to show how the multivariate PLS method can enable practitioners to predict the soft tissue changes more accurately than with the conventional, OLS method. Using 134 predictor and 36 response variables, two multivariate set prediction equations for estimating the soft tissue changes after mandibular setback surgery were formulated from the PLS and OLS methods, with the following conclusions. First, the multivariate PLS method demonstrated a significantly better predictive performance than the conventional OLS method. The bias pattern was more favorable, and the absolute prediction accuracy was significantly better with PLS than with OLS. Second, the multivariate PLS method was more satisfactory than the OLS method in accurately predicting the soft tissue profile changes after Class III mandibular setback surgery. References 1. Kasai K: Soft tissue adaptability to hard tissues in facial profiles. Am J Orthod Dentofacial Orthop 113:674, 1998 2. Naoumova J, Söderfeldt B, Lindman R: Soft tissue profile changes after vertical ramus osteotomy. Eur J Orthod 30:359, 2008 3. Shaughnessy S, Mobarak KA, Høgevold HE, et al: Long-term skeletal and soft-tissue responses after advancement genioplasty. Am J Orthod Dentofacial Orthop 130:8, 2006 4. Gallagher DM, Bell WH, Storum KA: Soft tissue changes associated with advancement genioplasty performed concomitantly with superior repositioning of the maxilla. J Oral Maxillofac Surg 42:238, 1984 5. Chew MT, Sandham A, Wong HB: Evaluation of the linearity of soft- to hard-tissue movement after orthognathic surgery. Am J Orthod Dentofacial Orthop 134:665, 2008 6. Alves PV, Mazucheli J, Vogel CJ, et al: How the lower face soft tissue changes after mandibular advancement or setback. J Craniofac Surg 19:593, 2008 7. Joss CU, Vassalli IM, Thüer UW: Stability of soft tissue profile after mandibular setback in sagittal split osteotomies: A longitudinal and long-term follow-up study. J Oral Maxillofac Surg 66:1610, 2008 8. Mobarak KA, Krogstad O, Espeland L, et al: Factors influencing the predictability of soft tissue profile changes following mandibular setback surgery. Angle Orthod 71:216, 2001 e562 PREDICTING SOFT TISSUE CHANGES AFTER MANDIBULAR SETBACK SURGERY 9. Enacar A, Taner T, Torog˘lu S: Analysis of soft tissue profile changes associated with mandibular setback and double-jaw surgeries. Int J Adult Orthodon Orthognath Surg 14:27, 1999 10. Schatz JP, Tsimas P: Cephalometric evaluation of surgical-orthodontic treatment of skeletal class III malocclusion. Int J Adult Orthodon Orthognath Surg 10:173, 1995 11. Eckhardt CE, Cunningham SJ: How predictable is orthognathic surgery? Eur J Orthod 26:303-309, 2004 12. McCollum AGH, Gardener GJM, Evans WG, et al: Soft-tissue changes related to mandibular advancement surgery. Semin Orthod 15:161, 2009 13. McCollum AGH, Dancaster JT, Evans WG, et al: Sagittal softtissue changes related to the surgical correction of maxillarydeficient class III malocclusions. Semin Orthod 15:172, 2009 14. Ksiezycki-Ostoya BK, McCollum AGH, Becker PJ: Sagittal softtissue changes of the lower lip and chin associated with surgical maxillary impaction and consequent mandibular autorotation. Semin Orthod 15:185, 2009 15. Ingervall B, Thüer U, Vuillemin T: Stability and effect on the soft tissue profile of mandibular setback with sagittal split osteotomy and rigid internal fixation. Int J Adult Orthodon Orthognath Surg 10:15-25, 1995 16. Kaipatur NR, Flores-Mir C: Accuracy of computer programs in predicting orthognathic surgery soft tissue response. J Oral Maxillofac Surg 67:751, 2009 17. Joss CU, Joss-Vassalli IM, Kiliaridis S, et al: Soft tissue profile changes after bilateral sagittal split osteotomy for mandibular advancement: A systematic review. J Oral Maxillofac Surg 68: 1260, 2010 18. Joss CU, Joss-Vassalli IM, Bergé SJ, et al: Soft tissue profile changes after bilateral sagittal split osteotomy for mandibular setback: A systematic review. J Oral Maxillofac Surg 68:2792, 2010 19. Wehrens R: Chemometric with R: Multivariate Data Analysis in the Natural Sciences and Life Sciences (ed 1). Heidelberg, Springer, 2011 20. Zhou XF, Shao Q, Coburn RA, et al: Quantitative structureactivity relationship and quantitative structure-pharmacokinetics relationship of 1,4-dihydropyridines and pyridines as multidrug resistance modulators. Pharmacol Res 22:1989, 2005 21. Martins JPA, Teofilo RF, Ferreira MMC: Computational performance and cross-validation error precision of five PLS algorithms using designed and real data sets. J Chemometr 24:320, 2010 22. Krishnan A, Williams LJ, McIntosh AR, et al: Partial least squares (PLS) methods for neuroimaging: A tutorial and review. Neuroimage 56:455, 2010 23. Dai JJ, Lieu L, Rocke D: Dimension reduction for classification with gene expression microarray data. Stat Appl Genet Mol Biol 5:6, 2006 24. Hastie T, Tibshirani R, Friedman J: The Elements of Statistical Learning. Data Mining, Inference, and Prediction (ed 2). New York, Springer Verlag, 2009 25. Lee D, Lee W, Lee Y, et al: Super-sparse principal component analyses for high-throughput genomic data. BMC Bioinformatics 11:296, 2010 26. Jones RM, Khambay BS, McHugh S, et al: The validity of a computer-assisted simulation system for orthognathic surgery (CASSOS) for planning the surgical correction of class III skeletal deformities: Single-jaw versus bimaxillary surgery. Int J Oral Maxillofac Surg 36:900, 2007 27. Kusnoto B: Two-dimensional cephalometry and computerized orthognathic surgical treatment planning. Clin Plast Surg 34: 417, 2007 28. Johnston C, Burden D, Kennedy D, et al: Class III surgicalorthodontic treatment: A cephalometric study. Am J Orthod Dentofacial Orthop 130:300, 2006 29. Choung PH: A new osteotomy for the correction of mandibular prognathism: Techniques and rationale of the intraoral verticosagittal ramus osteotomy. J Craniomaxillofac Surg 20:153, 1992 30. Lindberg W, Persson JA, Wold S: Partial least-squares method for spectrofluorimetric analysis of mixtures of humic-acid and lignin sulfonate. Anal Chem 55:643, 1983 31. Akaike H: A new look at the statistical model identification. IEEE Trans Autom Contr 19:716, 1974 32. Johnson RA, Wichern DW: Applied Multivariate Statistical Analysis. Pearson, Prentice Hall, NJ, 2007 33. Martens M, Martens H, Wold S: Preference of cauliflower related to sensory descriptive variables by partial least-squares (PLS) regression. J Sci Food Agric 34:715, 1983 34. Wold S, Ruhe A, Wold H, et al: The collinearity problem in linear-regression—The partial least-squares (PLS) approach to generalized inverses. Siam J Sci Stat Comp 5:735, 1984 35. Geladi P, Kowalski BR: Partial least-squares regression—A tutorial. Anal Chim Acta 185:1, 1986 36. Höskuldsson A: PLS regression methods. J Chemometr 2:211, 1988 37. Wold S: Cross-validatory estimation of number of components in factor and principal components models. Technometrics 20:397, 1978 38. Shao J: Linear-model selection by cross-validation. J Am Stat Assoc 88:486, 1993 39. R Development Core Team: R: A Language and Environment for Statistical Computing. Vienna, Austria, R Foundation for Statistical Computing, 2012 40. Tobias RD: An Introduction to Partial Least Squares: TS-509. Cary, NC, SAS Institute, 2006 41. Lee SJ, An H, Ahn SJ, et al: Early stature prediction method using stature growth parameters. Ann Hum Biol 35:509, 2008 42. Burden D, Johnston C, Kennedy D, et al: A cephalometric study of class II malocclusions treated with mandibular surgery. Am J Orthod Dentofacial Orthop 131:e1, 2007 43. Forsberg CM: Facial morphology and ageing: A longitudinal cephalometric investigation of young adults. Eur J Orthod 1:15, 1979 44. Hwang HS, Yuan D, Jeong KH, et al: Three-dimensional soft tissue analysis for the evaluation of facial asymmetry in normal occlusion individuals. Korean J Orthod 42:56, 2012 45. Dolce C, Hatch JP, Van Sickels JE, et al: Five-year outcome and predictability of soft tissue profiles when wire or rigid fixation is used in mandibular advancement surgery. Am J Orthod Dentofacial Orthop 124:249, 2003 46. Kau CH, Cronin A, Durning P, et al: A new method for the 3D measurement of postoperative swelling following orthognathic surgery. Orthod Craniofac Res 9:31, 2006 47. Kolokitha OE. Validity of a manual soft tissue profile prediction method following mandibular setback osteotomy. Eur J Dent 1:202, 2007 48. Gjørup H, Athanasiou AE: Soft-tissue and dentoskeletal profile changes associated with mandibular setback osteotomy. Am J Orthod Dentofacial Orthop 100:312, 1991


© Copyright 2025