Review of Venn Diagrams and Probability
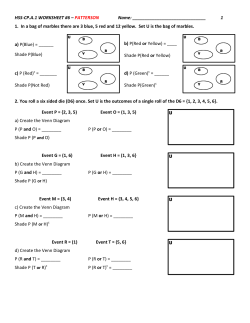
CP Statistics - Review of Venn Diagrams and Probability For each of the following scenarios, sketch a Venn diagram then use it to answer each question. Express all probabilities first, as a fraction and the as a decimal rounded to 3 places. 1. Of 400 college students, 120 are enrolled in math, 220 are enrolled in English, and 55 are enrolled in both. If a student is selected at random, find the probability that a. b. c. the student is enrolled in mathematics. the student is enrolled in mathematics or English. the student is enrolled in either mathematics or English, but not both. 2. In a group of 35 children, 10 have blonde hair, 14 have brown eyes, and 4 have both blonde hair and brown eyes. If a child is selected at random, find the probability that the child has blonde hair or brown eyes. 3. A survey of couples in a city found the following probabilities: The probability that the husband is employed is 0.85. The probability that the wife is employed is 0.60. The probability that both are employed is 0.55. A couple is selected at random. Find the probability that a. at least one of them is employed. b. exactly one of them is employed c. neither is employed. 4. Given the Venn diagram below with set A and set B, determine the following: A 5. B P(A) = P(A and B) = P(B) = P(A or B) = P(Ac) = P(A and Bc) = P(Bc) = P(Ac and B) = Convert the two-way table into a Venn diagram. Then find the given probabilities. A B 18 Bc 8 P(A and B) Ac 10 6 P(A and Bc) P(Ac and B) P(Ac and Bc)
© Copyright 2025


