profile - Australian Natural Resources Data Library
National Indigenous Forestry Strategy
Port Augusta Indigenous Coordination Centre
Area profile
Location
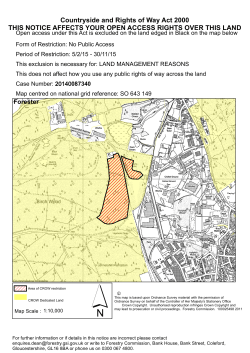
• The Port Augusta ICC area is located in the north half of the
State of South Australia. It comprises of approximately 67.2
million hectares, of which 5.7 million hectares are
forested.
• The areas boundaries are made up of the Northern
Territory border to the north, New South Wales State
border to the east and the Western Australia State
border to the west. The area also shares common
boundaries with the Ceduna and Adelaide ICC area to the south.
• The area coordination office is located in the city of Port Augusta.
Land Tenure
• The most widespread tenure type in the area is Leasehold land, with 48% of the total
area attributed to that tenure type. Other common tenure types in the area include
Nature Conservation Reserves, Other Crown Land and lands with Unresolved Tenure.
Port Augusta tenure types
Leasehold
Nature Conservation Reserve
Unresolved Tenure
Other Crown Land
Private leasehold
Total
Hectares
32,314,294
12,391,664
11,132,384
10,988,429
406,681
67,233,452
Percent of total
48
18
17
16
1
100
Forest type
• The most dominant forest type is Eucalypt forest, covering 5% of the total area and
making up 60% of the areas forests. Acacia forests are also common, making up 33%
of the areas forests.
Forest Type
Eucalypt
Acacia
Callitris
Casuarina
Mangroves
Other
Plantations
Totals
Total Forest (ha) Percent of forest Percent of total area
3,404,997
60
1,856,115
33
243,338
4
135,068
3
10,049
0
7,965
0
3,879
0
5,661,411
100
5
3
0
0
0
0
0
8
Soils
• The centre of this area is dominated by red duplex soils, loams and calcareous earths.
Regions of sandy soils are present in the northwest along with areas of non calcareous
earths. Sandy soils are also present in the north east along with clays in the river and
flood zones of the inland lakes.
Climate
• The dominant climatic zone in the area is desert hot (persistently dry) covering almost
the entire region, with areas of desert warm (persistently dry) and grassland warm
(persistently dry) in the south east.
• On average the city of Port Augusta receives 243mm of rainfall each year, with no
major dry or wet periods.
• Average daily minimum and maximum temperatures in the city
Port Augusta
Average maximum
Average minimum
Mid-Winter Mid- Summer
17°C
32°C
7°C
19°C
Population
• Total population of ICC area: 84,855 (6% of South Australia’s population and 0.5% of
the entire nation’s population).
• Largest City: Whyalla (21,211)
• Largest Indigenous population: Port Augusta (2,006)
Social indicator table
Social Indicator
Total population (2001)
Total population living in urban centres
Total rural population
Percentage of population living in urban centres
Average annual growth rate based on population change (19962001)
Number of people employed in forestry and logging
Number of people employed in Agriculture, Fisheries and Forestry
Persons employed in forestry and logging as a percentage of all
persons employed in Agriculture, Fisheries and Forestry
Proportion of employed persons working in the industry sector of
forestry and logging
Number of people employed in Paper and Wood Products
Manufacturing
Proportion of employed persons working in the industry sector of
Wood and Paper product manufacturing
Percentage of high income households
Proportion of low income households
In ICC Area
84,855
67,645
17,210
79.7%
State or
Territory
National
1,458,327 18,757,139
1,300,539 16,823,254
157,788 1,933,885
89.2%
89.7%
-0.6%
26
0.5%
862
1.1%
10,944
3,218
36,855
330,466
0.8%
2.3%
3.3%
0.08%
0.14%
0.13%
90
6,163
63,383
0.28%
18.6%
20.4%
0.98%
23.2%
16.4%
0.78%
29.4%
13.9%
ICC Areas: Regional socio-demographic figures were compiled from aggregated 2001 SLA data. The population of an SLA was
attributed to an ICC area if over 50% of the SLA fell within that area.
Climate information data source: Australian Bureau of Meteorology, (BOM) 2006, ‘Climate Averages for Australian Sites’.
Social Indicator data source: Australian Bureau of Statistics (ABS) 1996-2001, Census of Population and Housing.
Data based on the place of enumeration. Data supplied by ABS as customised tables at statistical local area (SLA) geography.
Disclaimer: Data used are assumed to be correct as received from the data suppliers. The Bureau of Rural Sciences, its
employees and advisors disclaim any liability, including all liability for negligence, any loss, damage or injury incurred by any
person as a result of accessing, using or relying upon any of the information or data set out in this publication to the maximum
extent permitted by law.
© Copyright 2025


