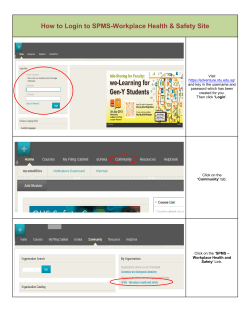
How to use qs-STAT freeware For support please contact: Henning Nielsen:
How to use qs-STAT freeware
For support please contact:
Henning Nielsen:
+45 21 57 81 05; henning.nielsen@velux.com
Ellen Winther:
+45 20 12 49 33; ellen.winther@velux.com
Niels Jørgen Jensen:
+45 23 31 71 79; nj.jensen@velux.com
Version 03: 08/08/2013
1
Index of contents
Slide no.
Start qs-STAT freeware
3
Choose/ change analysis module
4
Create a new test plan
5
Fill master data
6
Set characteristic list
7
Fill characteristic data
8
Add/ delete characteristic
9-10
Enter values / additional data
11
Additional data
12
Move additional data to right/ left
13
Input sequence
14-15
Save data
16-18
Create reports
19
Create reports
20
2
Start qs-STAT freeware
3
Choose/ change analysis module
When you start the qs-STAT Freeware
to make an analysis, check whether
you are in the Sample Analysis or
Process Capability Analysis module.
If not the right one - you can change
the module in the top menu Module.
4
Create a new test plan
To create a new test plan click File New, and select
number of characteristics.
In the Default menu you can select the default settings of
the characteristics.
Note: Measured quantity must always be undefined.
When the Default settings is made, continue
with OK, and when the number of
characteristics is set continue again with OK.
5
Fill master data
The test plan is now created and you will now have to fill in data.
1
3
2
4
6
5
7
8
1.
2.
3.
4.
5.
6.
7.
8.
Important to change this number for each set of data:
VELUX plant number (4- digit number)
Supplier Name
Supplier number (from VELUX SAP)
Part number + operation number (xxxxxx.xx)
Drawing number
Edition number
Order number, batch number, production number or Test Requisition number. Change this
number for each set of new data
Could be AS for sample, PC for process or MSA (optional)
6
Set characteristic list
Set Characteristic list (same procedure for all views):
-Right click on the mask
- Choose ”Graphic settings”
Now the list is added
7
Fill characteristic data
Characteristic mask:
14
9
10
11
12
13
9.
10.
11.
12.
The characteristic no. and Description
Nominal Value, upper and lower limit
Only if the characteristic is Roundness, Concentricity or Parallelism the “low nat bound” must be checked.
The Capability requirements are set with the capability class. Please check 23.887200.89.xx for further
information. See table for compliance .
13. Normally set to Recording Type ”Manual” – other fields empty. If you want to collect data from a gage wih a
RS232 output, then select the interface type in Recording Type and enter a gage no. and description (eg. 12,
caliper)
14. Repeat steps 9-13 for all characteristics. Use these symbols to move forward and backward in the list of
characteristics or select in the characteristic list (left)
8
Add/ delete characteristic
To create an extra characteristic:
Right click where you want to add an extra
characteristic
9
Add/ delete characteristic
To create or delete characteristic:
Now an extra
characteristic has been
added.
Remember to define the
nominal & tolerances in
“Characteristics mask”
You can also delete a
Characteristic
10
Enter values / additional data
When all the characteristics are set, continue to enter
the measured values with Values mask
Data entry:
There are two different principles:
- Direct data entry in the values mask
- Copy/ paste data from another source – e.g. excel
Additional data:
As default the Values mask displays some additional data:
This can be disabled with a right click on the value mask
11
Additional data
Mark
-No highlights
-all characteristics
-Then OK
OR
Choose the additional data you like
to be displayed.
12
Move additional data to right/ left
Right click on the additional data you like to move
13
Input sequence
As default the active cell moves downwards then you input values.
If you want to change this, then click on the Part/Characteristic list bottom
14
Input sequence
Right click on the Part/Characteristic list:
Select the Input sequence tab and mark
“after every value” – Default – OK
15
Save data
When all the measurements are entered the test plan must be saved as a file.
Then using qs-STAT freeware, all the data and all data templates
must be saved on your local computer.
See next slide as an example how this file structure can be.
Then you want to upload data to VELUX database (from the
webpage) it’s important only to have the data you like to analyze
Therefore you have to create a new file for each set of data (each
order, production or batch no.)
To make this easier:
Save a master for each part no, so you don’t
have to create new characteristics each time
16
Save data
Example
Main folder
Part description or/and part no.
Order, production, test
requisition or batch no.
Drawing edition
qs-STAT template (no data,
only characteristics)
Create your own local folder structure.
Just make sure all records are stored under an unique number or text
17
Save data
All other parameters may be the same each
time, but “Order number” MUST be changed
Then data is uploaded to database from webpage, VELUX must be
sure to distinguish all the data later.
The most important parameter is “Order number”
This MUST be changed for each new set of data.
18
Create reports
To make a report, the test plan must be uploaded to VELUX qs-STAT web
module (Sample analysis). This is done by entering VELUX.com
Open Sample analysis
Contact VELUX to
get username &
password
19
Create reports
3
1
2
7
6
4
5
1.
2.
3.
4.
5.
6.
7.
To upload the file click on the Browse bottom (the top one)
Execute to get the file
Select the Evaluation strategy
Select how to view the values to the right (after selection, tab the icon)
Navigate through all the individuals
Select which report to see. Tab the icon and it will open in PDF. Save this file local. This report can be
attached to a mail to VELUX.
Tab Save and the data will be stored in VELUX database.
20
© Copyright 2025


