Statistics in the NZ Curriculum Stocktake Mike Camden
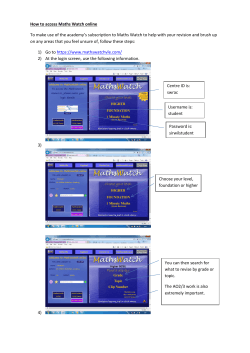
Statistics in the NZ Curriculum Stocktake Mike Camden NZ Statistical Association Education Committee Mike: mike.camden@stats.govt.nz NZSA: http://www.stat.auckland.ac.nz/nzsa/ NZSA Newsletter: http://nzsa.rsnz.govt. nz/newsletter58 Health warning: The views in here belong - Either to the Stat Assoc Education Committee - Or to Mike - Or to both. They are not intended as the views of Statistics New Zealand. NZ Statistical Association Education Committee: For NZ Curriculum Stocktake Group; 21 Oct 03 1 Proposed Contents of Session: A Club Sandwich Stats in Schools: Intros, multchoice test and the big ideas Workshop 1: Skills for a “Hot Off The Press” Background, illustrations, opinions and more illustrations Workshop 2: Stats and your Essential Learning Area Conclusion: The chocolate investigation; What Now. NZ Statistical Association Education Committee: For NZ Curriculum Stocktake Group; 21 Oct 03 2 Deterministic and Stochastic Thought Greek: Stokhastikos: Person who aims, targets, forecasts Stokhos: An aim, target English: Stochastic: involving ‘random’ probability distributions There’s an ELA called… Maths Maths and Stats Maths and Stats and Probability There’s a bunch of mental tools (“Maths”) with two sides: Deterministic thinking and modelling Stochastic thinking and modelling They’ve both been around since humans stood up, started talking and drawing, and invented Education! See Paper 8 in http://wwwmaths.anu.edu.au/other/ncms/mathsdocs/ Mumford, D (1999). The dawning of the age of Stochasticity. NZ Statistical Association Education Committee: For NZ Curriculum Stocktake Group; 21 Oct 03 3 Some odd things about Stats: “Maths” has two sides: Deterministic and Stochastic Stats (and Probability) is entangled with…. Language: English, Te Reo Maori, the others Graphics and visual communication Context: all the ELAs Maths Stats supports active learning in other ELAs via “investigations” “Entangled” has two directions ……. NZ Statistical Association Education Committee: For NZ Curriculum Stocktake Group; 21 Oct 03 4 The big questions for this session: Three questions: 1: How do we build Curriculum so that Stats supports your ELA? 2: How do we build Curriculum so that your ELA supports Stats? 3: How can Curriculum trigger students into enjoying and valuing both your ELA and Stats? JFK’s version (with stochastic input): And so, my fellow educators, ask not what your ELA can do for Stats; ask what Stats can do for your ELA. NZ Statistical Association Education Committee: For NZ Curriculum Stocktake Group; 21 Oct 03 5 A Multichoice Test: Q 1 of 3: for Achievement: The NZ Stat Assoc Education Committee’s aim is: A: Stuff Stats into every crack in the Curriculum B: Chuck half the Maths and replace it with Stats C: Streamline the Stats and Insert the Interconnectivity among ELAs (Yes, I did read the Listener!!) NZ Statistical Association Education Committee: For NZ Curriculum Stocktake Group; 21 Oct 03 6 A Multichoice Test: Q 2 of 3: for Merit: The Essence of Stats is: A: Weird graphs with kinky names B: Weird stuff like s2 = S(x – m)2/ n C: Investigations, contexts, datasets, variability, exploration, conclusions, communication Which one would look good in the Maths and Stats Essence Statement?? NZ Statistical Association Education Committee: For NZ Curriculum Stocktake Group; 21 Oct 03 7 A Multichoice Test: Q 3 of 3: for Excellence: Life and the tools we make for enjoying it are A: Mostly deterministic B: Mostly stochastic C: Basically stochastic, but deterministic models are often good working approximations. Hint: Best answer in each Question is C. NZ Statistical Association Education Committee: For NZ Curriculum Stocktake Group; 21 Oct 03 8 Stats in Schools: The big ideas: 1/3 Stats is quite different from the rest of Maths (our old theme) and so needs very careful treatment Stats and the rest of Maths stand together (our new theme) giving stochastic and deterministic models of life Stochastic (ie, variable) aspects of life are becoming more obvious: technology, environment, social policy … Some front-end statistical methods are … fun, commonsense, graphical and suddenly accessible to school students Context is hugely important in statistical thinking which is where you come in! Stats in the Curriculum must meet the needs of the parties to the Treaty of Waitangi NZ Statistical Association Education Committee: For NZ Curriculum Stocktake Group; 21 Oct 03 9 Stats in Schools: The big ideas: 2/3 Stats needs careful curriculum links with … the other Maths strands the other essential learning areas the other layers in the Framework: Principles, Future Focused Themes, Skills, Values, Attitudes Is there a literature on this?? We need a new engine for Stats curriculum, assessment, professional development, resource making We need a plan to build capability in Stats Pedagogy in NZ The NZ Stats Community is aware, alert, offering its insights They want NZ to get the Stats right! NZ Statistical Association Education Committee: For NZ Curriculum Stocktake Group; 21 Oct 03 10 Stats in Schools: The big ideas: 3/3 Graphical data exploration (data visualisation) is profound, powerful, accessible but takes lots of learning (ie, practice with datasets; yours!!). It must not be seen as trivial! Any Learning Area can link with Stats so that … both are valued as enjoyable and useful We’re at the forefront … Dammit!!! NZ Statistical Association Education Committee: For NZ Curriculum Stocktake Group; 21 Oct 03 11 A Scalpel for Stats Curriculum Constructors Any investigation has these stages: State the purpose, get approval Design and/or plan all aspects of it Collect the data into a Unit Record Dataset Edit/Launder/Clean the dataset with graphs etc Explore and/or analyse the dataset with graphs etc John Tukey: “If you haven’t done a graph, then you haven’t done an analysis” Summarise the findings/information/conclusions Communicate the Conclusions with words, numbers and graphs working together (Edwin Tufte: The visual display of quantitative information) Lets give up writing “Present the Data with Graphs” forever. NZ Statistical Association Education Committee: For NZ Curriculum Stocktake Group; 21 Oct 03 12 Another Scalpel: Any dataset that is remotely useful or interesting has several related variables: We stop pretending that variables ever occur alone. We replace ‘bi-variate data’ and ‘multi-variate data’ by ‘dataset’. Name Favourite Fruit Gender Trevor Mango Boy Steve Apple Boy Marion Apple Girl Turiana Apple Girl This thing’s a Dataset This thing’s a (Frequency) Table Gender Count Girl Boy Apple 2 1 Mango 0 1 Fruit NZ Statistical Association Education Committee: For NZ Curriculum Stocktake Group; 21 Oct 03 13 Workshop 1: Skills: what, where, how See SNZ’s “Hot Off The Press”, NZ Income Survey June 2003 Quarter; 1 Oct 03. Assume we want all NZers to be able to read, use and critique things like this. 1 What skills, attitudes and values do they need? 2 Whereabouts do we put these skills etc in the Curriculum Framework?? 3 What does NZ need, to ensure effective teaching, learning and assessment of the skills etc??? 4 Are we in the right Industry???? (See Table 10 near the end) NZ Statistical Association Education Committee: For NZ Curriculum Stocktake Group; 21 Oct 03 14 The Middle Bit: Background, illustrations, opinions, more illustrations … Mussels (Mytius Edulis): Chaffers Marina: Shell Vol(ml) vs Shell Length (mm) Stochastic and deterministic views ShellVol Cubic 45 40 35 30 25 20 15 10 5 0 0 20 40 60 80 100 NZ Statistical Association Education Committee: For NZ Curriculum Stocktake Group; 21 Oct 03 15 Some of the Communities of Interest in Maths Ed NZSA, its Education Com, Maths Teachers and Curric Makers The intersections are very small. NZ Statistical Association Education Committee: For NZ Curriculum Stocktake Group; 21 Oct 03 16 NZ Statistical Association Education Committee’s conclusions On Thur 11 Sept 03, the Committee discussed the Stocktake at length. Main conclusion: it offers to: Make input into and review the draft Framework document Be part of research projects that would underpin curriculum and resource writing Take a leadership role in the writing of the Statistics strand of the Curriculum document On Thur 9 Oct, it met with MoE people and discussed: Making input into Stats in the whole curriculum NZ Statistical Association Education Committee: For NZ Curriculum Stocktake Group; 21 Oct 03 17 Health Report for the Statistics Strand in Maths Bone structure mostly good but needs a hip replacement and some physio elsewhere Soft tissue functioning but needs several cut-and-tuck operations, several shots of Botox and a body-building programme at the gym; weight-watchers programme not indicated. Badly needs a hair transplant. Socialisation: (the main problem for us today) needs a ”how to win friends and influence people” course. NZ Statistical Association Education Committee: For NZ Curriculum Stocktake Group; 21 Oct 03 18 Biology Part 1: Stats in NCEA Biology Level 3 Explanatory Note 7: Recording and processing Data processing would usually involve calcs and graphing (Good!) to establish a relevant pattern or trend. Stat. procedures, where approp., should be used to establish the reliability (??) of the data e.g. mean, standard deviation, confidence intervals, standard error, difference between two means, ANOVA (??), Chi squared test(??). Sufficient data involves repeats, trials, appropriate range for the independent variable (Exp Design??), appropriate samp size. Systematically record means data will be presented in a way (eg table, tally chart) that allows it to be interpreted without reference to the method. (??) See NZSA Newsletter Sept 03: Gwenda Hill; Stats more advanced (more mathematical?) in Biology than in Maths for NCEA L3 NZ Statistical Association Education Committee: For NZ Curriculum Stocktake Group; 21 Oct 03 19 Biology Part 2: Views of senior NZ biometricians Ian Westbrooke; Dept of Conservation; NZSA Conf Jul 03: Staff’s (university) stats education has been on hypothesis tests and ANOVAs. What they need is confidence intervals that can lead to management decisions, and Exploratory Data Analysis (with graphs) Harold Henderson, Agresearch; NZAMT8; Jul 03: (Bevan Werry speech) Powerful new methods of data visualisation… produce a new frontier of data analysis. Visualisation tools provide deep insight into the structure of data…. Dynamic statistical graphics are now widely available…. Using these, the internal components of NCEA (L3) statistics can be presented by students in ways that are relevant, upand easy to understand. NZto-date Statistical Association Education Committee: For NZ Curriculum Stocktake Group; 21 Oct 03 20 Biology Part 3: the morals: What we can and should do in Stats is changing profoundly and fast How do we assure Statistics (and Maths) their most useful places in all the learning areas? How can we make the NZ Curriculum Engine produce 21st century objectives?? NZ Statistical Association Education Committee: For NZ Curriculum Stocktake Group; 21 Oct 03 21 The fun of the fair: Reflections on the Wellington Science Fair: Impressive statistics from 8 of the 400 Year 7 and 8 people The essence of statistical quality for statistics judges design replication graphs that show variability conclusions Science, years 7 and 8, seems to do much of the Experimental Design that has been removed from our NCEA L3! But we don’t provide the commonsense graphic tools needed. Reflections on the Canterbury and W Coast Science Fair Winners had their raw data well displayed, and were able to deal with its variability. NZ Statistical Association Education Committee: For NZ Curriculum Stocktake Group; 21 Oct 03 22 The Point of Inflection in Maths Education History Statistics is very different from the rest of Maths in… Its rate of change and its age (it is embryonic or possibly adolescent) The contexts and ways in which it gets used (and therefore the ways it can be valued) The way in which today’s complex world of technology and social needs depends on it The ways it can be taught, learned and assessed (the pedagogy…. And the pedagogues!!) The ways in which it uses computer technology The ways it can be integrated with other learning areas Teacher confidence, professional development needs and resource needs, in Maths and other ELAs NZ Statistical Association Education Committee: For NZ Curriculum Stocktake Group; 21 Oct 03 23 Rabid Opinions 1 of 2 Values Stats is founded on a Value: information-based decision-making. Curriculum and Assessment for Stats: We must make sure the engine pulls the carriage, and not the other way round. A fourth stage in Statistical education?? Stage 1: Traditional (what we got, and forgot!) Stage 2: Reformed (Data and EDA-based) Stage 3: Transformed (Value-based) Stage 4: Blossoming!! (Real issues, great data, dynamic software. It really is new.) Stats and Maths thinking are different; stats can’t be taught as is it were maths NZ Statistical Association Education Committee: For NZ Curriculum Stocktake Group; 21 Oct 03 24 Rabid Opinions 2 of 2 Hardware and Software: We’ve got to have it: In biology, chemistry, physics, geography, cooking, clothing, PE, …, students use the real tools and materials of the subject. So must Stats! The tools are the computer hardware and software; The materials are the datasets from the other ELAs. Students enjoy hands-on work with data, owning projects and completing investigations The Forefront in Stats education: NZ was there, but is now lagging behind. We need to address this, with your help The Essential Skill Numeracy needs to stay, andto be enhanced with Stat Reasoning, Thinking and Literacy. NZ Statistical Association Education Committee: For NZ Curriculum Stocktake Group; 21 Oct 03 25 Tupaia and James Oct 1769; the Endeavour sails from Tahiti to NZ. Tupaia and James are both strong on.. History Language Graphics Maths applied to navigation (Tupaia with sun, stars, wind, swells, clouds, birds and stochastic logic) (James with chronometer, sextant, logs and deterministic logic) Stats applied to demography (Tupaia estimated the size of military groups, James extrapolated to estimate the population of Tahiti) There are two heritages. NZ Statistical Association Education Committee: For NZ Curriculum Stocktake Group; 21 Oct 03 26 Equity, Ethnicity and Intervention A country has 2 Ethnicities, A (the majority) and B. The results of a survey are shown. Is there equity in income? If not, where should interventions be applied?? What subject is this??? (This happens!!) Income ($1000/year) with Education (Years of Sec+Tert Ed) for Ethnicities A and B 60 50 40 30 20 10 0 0 5 10 15 NZ Statistical Association Education Committee: For NZ Curriculum Stocktake Group; 21 Oct 03 27 Quakes and Spins In the past, earthquakes were seen as stochastic in space and time (and nasty) Now, we have: large qnd classy datasets software that can let us look into the data’s structure visualisation skills and all these are available to schools. an Excel interlude…. NZ Statistical Association Education Committee: For NZ Curriculum Stocktake Group; 21 Oct 03 28 Workshop 2: Stats and your Essential Learning Area Please team up with people from your ELA or with similar interests. 1 Think up an “investigation” with a dataset in it. 2 What Curriculum Level does it belong at? 3 What statistical skills does it cal on? 4 How do we get the skills and the links into curriculum documents? 5 Or.. Go back to Equity, Ethnicity and Intervention;slide 26. NZ Statistical Association Education Committee: For NZ Curriculum Stocktake Group; 21 Oct 03 29 Conclusions: 1/5 Into a blossoming future for Maths and Stats Ed There’s a sea of information on statistical… curriculum pedagogy teacher support resources (including software) assessment. We need to take a swim into it! It includes: ICOTS conferences (next: Brazil 2006) Online and free SERJ and JSE IASE Roundtable (Jul 2005; Sweden). On Curriculum Teaching Statistics American Statistician, May 03; Special Section on Stat Ed NZ Statistical Association Education Committee: For NZ Curriculum Stocktake Group; 21 Oct 03 30 Conclusions: The Good Stuff 2/5 Current curriculum has some outstanding strengths: the focus on Investigations the progression through investigation types and variable types. We can’t lose that. But we can’t rest on our laurels: Statistics has moved a huge distance since the mid 1980’s. The Links have yet to be created; There are conversations that have only just started. There’s progress in the draft Maths and Stats Essence Statement NZ Statistical Association Education Committee: For NZ Curriculum Stocktake Group; 21 Oct 03 31 Conclusions: The New Stats Strand 3/5 This time, it won’t be built top-down and in a hurry. The statistical community must be enabled to take leadership to work on it with all parties: teachers at all levels curriculum experts. Quality must be designed in; it can’t be patched in at the bottom of the cliff. This is a great opportunity! NZ Statistical Association Education Committee: For NZ Curriculum Stocktake Group; 21 Oct 03 32 Conclusion: Research, Resources, PD 4/5 We’re impressed by the care, expertise and work that went into Numeracy. We’d like an effort modelled on this for Stats: A scan of the sea of recent research curriculum analysis resource production, for: stats within maths stats everywhere else; “at large” research into how professional development can be best designed support for teachers at every stage. It’ll need fresh work on how to get Interconnectedness NZ Statistical Association Education Committee: For NZ Curriculum Stocktake Group; 21 Oct 03 33 Conclusions: For Statistics to blossom… 5/5 We need to build capability in teaching (content and pedagogy) teacher education and support (pre and inservice) resource production curriculum design assessment design research in all the above We need careful construction of Links. We need a new engine for leading statistical education! We all need each other!!! NZ Statistical Association Education Committee: For NZ Curriculum Stocktake Group; 21 Oct 03 34 NZ, with Quakes and 4 Main Centres shown: 2 3 4 5 6 7 8 9 11 -800 12 13 14 15 16 17 21 226 800 384 -101 110 142 339 A 209 467 142 400A 339 204 468 C 248 444 -160 D 31 0W 206 498 W -400 0 117 350 131 C 384 257 -400 462 D95 261 103 297 135 385 248 -800 375 226 -101 142 209 142 204 248 -160 206 400 117 131 257 95 103 135 248 384 110 339 467 339 468 444 31 498 -800 800 350 384 462 261 297 385 375 -3 NZ Statistical Association Education Committee: For NZ Curriculum Stocktake Group; 21 Oct 03 35 Quakes: Depth vs Distance SouthEast of Wgtn 800 400 0 -800 -300 200 700 -400 -800 NZ Statistical Association Education Committee: For NZ Curriculum Stocktake Group; 21 Oct 03 36
© Copyright 2025
