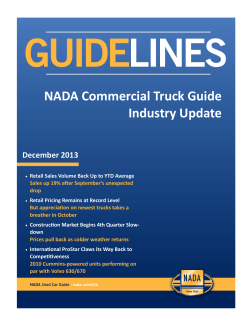
Guidelines NADA Used Car Guide Industry Update F NADA Official Used Car Guide
Guidelines
November 2013
NADA Used Car Guide Industry Update
INSIDE:
NADA Official Used Car Guide® Update
New & Used
Market Trends
Federal government closure exacerbates
Since October 2011
Prices drop by 3.5%; NADA’s used
vehicle price index falls to 123.8.
normal seasonal softness
The political impasse that led to the two-week long
federal government closure at the beginning of
October affected consumer confidence enough to
November Official Used Car Guide®
Movement
Average trade-in values reduced by an
average of 2.5%.
ding both new vehicle sales and used prices for the
month.
NADA Official
Wholesale used vehicle prices for units up to eight
Used Car Guide®
years in age fell by 3.5% in October, nearly a point
Value Trends
higher than the 2.6% decline recorded in September;
New Vehicle Sales Rate Flattens Out
October’s annual rate remains little
changed at 15.15M; prior-year growth
hits 11%.
the month’s figure was also sixth-tenths of a point
more than last year’s 2.9% decline. Without the
drama created by federal lawmakers, it’s likely that
Volkswagen’s New Deliveries Plummet
Sales fall by 18%; incentive spending
grows by 21%.
October’s rate of decline would have been right in line
with recent seasonal norms.
NADA Used Vehicle Price Index
Vehicles up to eight years in age. Seasonally adjusted.
130
down one point from September’s figure of
120
124.8. Year-to-date, however, prices remain
110
year, things weren’t much different as midsize van prices fell by 4.2% during the month.
Jul-12
Month
Source: NADA
Monthly AuctionNet Price Change - September v. October 2013
Vehicles up to eight years in age.
0.0%
The segment’s acute decline can be attributed
-0.5%
-1.0%
to its substantial rental fleet exposure and the
quantities of similarly equipped units at
auction over a compressed period of time.
-1.5%
Percent Change
fact that rental companies remarket large
-2.0%
-2.5%
-2.3%
-3.0%
-2.4%
-2.8%
-2.9%
-3.5%
-4.0%
-3.6%
-3.4%
-3.4%
Mid-Size
Car
Mid-Size
Utility
-3.5%
-3.8%
-4.5%
-4.7%
-5.0%
Compact
Car
Source:NADA
NADA
Source:
Compact
Utility
Large
Pickup
Large SUV Luxury Car
Luxury
Utility
Segment
NADA Used Car Guide | 8400 Westpark Drive | McLean, VA 22102 | 800.544.6232 | www.nada.com/b2b
Mid-Size
Van
Market
Average
Sep-13
Feb-13
Oct-10
Dec-11
Mar-10
May-11
Jan-09
Jun-08
Aug-09
Apr-07
Sep-06
Nov-07
Jul-05
Feb-06
Oct-03
Dec-04
May-04
Jan-02
Aug-02
Mar-03
Jun-01
where prices fell by 4.7%. Looking back one
Apr-00
70
Nov-00
decline was recorded in mid-size van segment
Jul-98
80
Jan-95
At the segment level, the biggest monthly
Oct-96
90
Mar-96
last year.
October 2013: Index falls by one
point to 123.8 versus September's
figure of 124.8.
100
May-97
0.5% higher than they were through October
January 2010 = 100
adjusted used vehicle price index to 123.8,
Aug-95
October’s softness dropped NADA’s seasonally
Sep-99
NADAguides.com
Consumer Site
Trends
Feb-99
Fuel Price Data
Dec-97
Economic Update
At NADA Used
Car Guide
Used Prices Fall by Largest Amount
Guidelines | November 2013
Used Car Guide Update (continued…)
A review of 2013 model year auction data reveals that there was a 19.3% increase in the number of mid-size van units running
through the lanes in October compared to what was recorded in September; by comparison, volume for mid-size cars and
compact utilities – two other fleet-heavy segments – grew by 8.0% and 9.0%, respectively. Despite the month’s big loss, on an
annual basis mid-size vans are actually performing quite well with prices 3.5% higher than they were last October.
Luxury cars and compact cars are two more segments that experienced declines slightly higher than the market average where
prices fell by 3.8% and 3.6%, respectively. Last year luxury car prices fell by 3.5% and compact cars declined by 3.1% during the
month – again, slightly less than what was recorded this year.
Mid-size cars and mid-size utility prices each fell by 3.4% apiece, while smaller declines were recorded in the compact utility,
large SUV and luxury utility segments, with prices for each dropping within a tight range of 2.4% to 2.9%. Compared to other
segments, large pickups posted another strong showing last month, but October’s 2.3% decline was slightly more than the 2.0%
fall recorded during the same period in 2012 and also quite a bit higher than the previous three-month average of 0.4%.
Annual AuctionNet Price Change - Year-to-Date, 2012 v. 2013
Through October. Vehicles up to eight years in age.
10.0%
8.9%
8.0%
8.0%
6.0%
Percent Change
On a year-to-date basis, vehicles up to eight years in age carried a
mix and seasonally-adjusted average price of $15,066, a figure up
slightly from 2012’s average of $15,042 and $388 higher than 2011’s
average of $14,678. In terms of annual gains, large pickups and large
SUVs continue to overshadow the rest of the market. So far this year,
prices have risen by 8.9% and 8.0%, respectively, for each segment;
for large pickups this equates to a 0.2% lift over September’s year-todate, while annual growth remained unchanged for large SUVs.
3.5%
4.0%
2.1%
2.0%
0.5%
0.0%
-0.5%
-2.0%
As previously mentioned, mid-size vans have also experienced
-0.8%
-1.0%
-0.7%
-1.5%
-4.0%
substantive price growth this year, with the year-to-date increase
inching up by one-tenth of a point from September’s figure to 3.5%.
Compact
Car
Source:NADA
NADA
Source:
Compact
Utility
Large
Pickup
Large SUV Luxury Car
Luxury
Utility
Mid-Size
Car
Mid-Size
Utility
Mid-Size
Van
Market
Average
Segment
The annual change in mid-size utility prices also remained in the positive, however no growth was recorded in October and price
growth stayed fixed at a figure 2.1%. Prices for all other segments are down compared to last year, with the 1.5% fall in luxury car
prices being the steepest.
Regarding auction volume, the number of AuctionNet® wholesale
AuctionNet® Auction Volume: 4-Week Change
transactions collected for vehicles up to eight model years in age fell The change in auction volume between the most recent 4 week period and the preceding
by 1.2% over the four-week period ending the week of October 28th. 4 weeks.
Volume by Model Year Group
This comes after a slight 0.3% increase recorded during September.
MY 2006-07 MY 2008-09 MY 2010-11 MY 2012-13 MY 2006-13
Period*
4-wk Period
66,050
45,591
75,067
85,130
271,838
Last month’s decline in auction transactions was fueled primarily by Prior
Current 4-wk Period
62,426
43,890
76,909
85,286
268,511
Difference (%)
-5.5%
-3.7%
2.5%
0.2%
-1.2%
a 5.5% fall off in 2006-07 model year units along with a 3.7%
Source: NADA
decrease in 2008-2009 model year units. However, there was a 2.5%
increase in 2010-2011 model year volume and also a slight 0.2% uptick in 2012-2013 volume.
November – December used vehicle price forecast
Projecting through December, given the absence of any looming governmental crisis there is little to suggest that depreciation
over the final two months of the year will materially deviate from seasonal trends. Lower consumer confidence does provide
concern that consumer demand – and thus used vehicle prices –could take a steeper-than-expected downward turn. However,
it’s believed that confidence will rebound given the end of the federal government hiatus and October’s decent employment
report.
NADA Used Car Guide | 8400 Westpark Drive | McLean, VA 22102 | 800.544.6232 | www.nada.com/b2b
2
©2013 NADA Used Car Guide
Guidelines | November 2013
Used Car Guide Update (continued…)
As such, NADA expects that used prices will fall by an average of approximately 1.9% over the course of the next two months,
which is an estimate unchanged from last month’s forecast. While decidedly higher than 2012’s Superstorm Sandy-influenced
decline of 0.9%, this year’s forecast is just slightly higher than 1.5% decline recorded for the period back in 2011. As is the
seasonal norm, depreciation is expected to progressively improve as we move through November and into the start of 2014.
October’s result along with NADA’s prediction for the remainder of the year would see used vehicle prices finish 0.3% to 0.8%
higher than 2012’s record level.
November Official Used Car Guide® value movement
Trade-in values in November’s edition of the Official Used Car Guide® were lowered by an average of 2.5%, which is the most
significant reduction recorded since last November’s adjustment of 2.7%. Reductions across model years fell within a tightly
grouped range of 2.2% to 2.8%, with least-to-greatest figures corresponding to the 2009 and 2012 model years, respectively.
Continuing a long-running trend, car value reductions outpaced those of trucks, this time by a score of 3.1% to 1.8%. Across car
segments, more severe adjustments were centered on upper sport (-3.9%), subcompact (-3.7%) and luxury large (-3.7%) models,
while values for the two most voluminous car segments (compact and mid-size cars) were reduced by an average of 3.3%.
For subcompact cars, the slash in values was exacerbated by the decline of 35 cents in gasoline prices since the beginning of
September, which helped to drag values for models such as the Mazda Mazda2, Ford Fiesta, Nissan Versa and Fiat 500 down by
figures as high as 4.0% to 5.0% in this month’s edition.
As far as trucks are concerned, the 2.1% drop in mid-size utility and van values was followed closely by a 2.0% reduction in large
SUV, luxury mid-size utility and compact utility values. Values for remaining truck segments were cut by an average of 1.2%,
excluding the large pickup segment where prices were trimmed by just 0.8%. There has been much made of 5.0% year-to-date
increase in new pickup incentives as of late, but strong demand from both consumers and businesses (construction, mining and
manufacturing) and a larger rise in new vehicle transaction prices has virtually negated any associated downward pressure on
used vehicle values.
New vehicle sales climbed 10.5%, SAAR rises to 15.15M units
October was a strong month as new vehicle sales of 1.2 million units reflected a 10.5% lift over last year’s 1.09 million deliveries.
Ten months into 2013, the total sales figure of 12.9 million units is 8.3% higher than the previous year’s 11.9 million units.
The seasonally-adjusted annual rate (SAAR) climbed to 15.15 million units in October from last year’s 14.33 million, up 5.7%.
Through October, the SAAR fell to its lowest level of the year, ahead of only April’s 14.87 million.
New Vehicle Sales
New Vehicle SAAR
New Vehicles Sales
1.6
YoY Change
SAAR
20%
1.4
New Vehicle SAAR (millions)
Sales Volume (millions)
5%
0.6
0%
0.4
-5%
0.2
0.0
15
12%
10%
14
8%
13
6%
Percent Change
0.8
Percent Change
10%
16%
14%
15%
1.2
1.0
YoY Change
16
4%
12
2%
-10%
11
Month
0%
Month
Source: Wardsauto.com
Source: Wardsauto.com
NADA Used Car Guide | 8400 Westpark Drive | McLean, VA 22102 | 800.544.6232 | www.nada.com/b2b
3
©2013 NADA Used Car Guide
Guidelines | November 2013
Used Car Guide Update (continued…)
Mainstream Brand Performance (Units Sold)
U.S. brands up across the board
Buick
Chevrolet
Chrysler
Dodge
Fiat
Ford
GMC
Honda
Hyundai
Jeep
Kia
Mazda
Mini
Mitsubishi
Nissan
Ram
Scion
Smart
Subaru
Toyota
Volkswagen
Domestic automakers collectively sold almost 553,000 units in
October, up 13.9%, as the Big Three each grew by 10.7% or
more. All three are on a roll in 2013 and together sold 5.87
million vehicles through 10 months, reflecting a 9.7% gain.
General Motors continues to lead its American counterparts in
not only aggregate sales, totaling over 226,000 units in October,
but also growth, which was up 15.7%. Each GM brand achieved
a sales bump of at least 9.5%, with Buick’s 31.2% jump leading
the pack. The difference-maker for Buick was undoubtedly the
Regal sedan, up 46.9%, which compensated for decreased
LaCrosse and Verano demand, while the new Encore compact
Oct-13
17,555
155,214
23,452
45,314
3,674
180,544
38,841
100,242
53,555
36,379
39,754
19,738
5,700
4,752
81,866
29,977
4,940
513
34,483
141,317
28,129
Sep-13
15,623
127,785
25,251
48,576
3,157
174,595
29,959
93,915
55,102
37,464
38,003
22,464
5,306
4,001
77,828
27,397
5,131
625
31,755
139,804
31,920
Oct-12
13,384
135,305
22,222
40,611
3,720
159,209
33,570
94,810
50,271
34,023
42,452
18,622
5,888
3,981
70,928
24,785
5,887
998
26,119
129,505
34,311
Change From
Month Ago
Year Ago
12%
31%
21%
15%
-7%
6%
-7%
12%
16%
-1%
3%
13%
30%
16%
7%
6%
-3%
7%
-3%
7%
5%
-6%
-12%
6%
7%
-3%
19%
19%
5%
15%
9%
21%
-4%
-16%
-18%
-49%
9%
32%
1%
9%
-12%
-18%
Oct-12
12,163
11,708
26,451
13,505
8,757
699
3,129
19,850
5,154
25,643
3,211
4,200
Change From
Month Ago
Year Ago
23%
18%
0%
11%
17%
4%
7%
10%
1%
5%
15%
117%
27%
37%
16%
14%
11%
38%
20%
25%
15%
11%
-6%
-7%
Source: Wa rds Auto
Luxury Brand Performance (Units Sold)
SUV added 3,602 deliveries to the product portfolio.
Ford Motor Company kept the good times rolling as its nearly
Acura
Audi
BMW
Cadillac
Infiniti
Jaguar
Land Rover
Lexus
Lincoln
Mercedes-Benz
Porsche
Volvo
188,000 deliveries reflected a 14.2% increase over last
October’s deliveries. The struggling Lincoln brand successfully
sold 38% more vehicles than last year and had the biggest
growth in the industry with the exception of the small Jaguar
brand. Lincoln’s highest-selling model, the MKZ, increased sales
by 80.2% and is the luxury brand’s leading seller this year, with
Oct-13
14,296
13,001
27,574
14,792
9,152
1,515
4,286
22,719
7,131
32,107
3,562
3,919
Sep-13
11,648
13,065
23,568
13,828
9,040
1,313
3,387
19,522
6,453
26,849
3,093
4,188
Source: Wa rds Auto
6.4% growth. Showing little signs of slowing down, the Blue Oval brand was up 13.4%, with over 180,000 deliveries, and was led
by its Fusion sedan and its F-Series truck, up 71.3% and 13.8%, respectively.
Chrysler Group LLC rounded out the three with just under 139,000 sales, which was a 10.7% improvement, but is ahead of GM for
the year with 8.8% growth. Italian brand Fiat was down 1.2%, but the American makers were all up for the month, led by the Ram
brand with a 20.9% sales increase. Dodge went up 11.6% thanks to the much-improved Charger and Durango demand, up 59.7%
and 58.5%, respectively. Meanwhile, Jeep sales increased by 6.9% due to solid improvements by the Compass and Grand
Cherokee, up 68% and 19.7%, respectively.. After months of delays to the new Cherokee stemming from engineering issues, the
new Jeep SUV finally went on sale and picked up its first 579 deliveries.
Import sales growing, but lag behind domestics
Importers realized 7.6% growth by selling over 647,000 vehicles in October, but were overshadowed by strong domestic sales
and thus performed 2.9% below the industry average. Japanese makers were the only ones to keep up with the industry as
deliveries from the island nation’s automakers were up 10.4% after punching nearly 434,000 sales, which was 67% of all import
brand sales combined. Among the Japanese Big Three’s roughly 375,000 deliveries, a 9.5% gain, only Nissan posted an aboveaverage month with a 14.2% lift.
NADA Used Car Guide | 8400 Westpark Drive | McLean, VA 22102 | 800.544.6232 | www.nada.com/b2b
4
©2013 NADA Used Car Guide
Guidelines | November 2013
Used Car Guide Update (continued…)
Japan’s performance was primarily anchored by Subaru, which sold over 34,000 units to achieve a 32% jump and continued its
remarkable run on the backs of its Forester and XV Crosstrek models, up 137% and 181.6%, respectively. As of October, the 9.1%
rise in Japanese brand sales remains solidly above the industry average of 8.3%.
Toyota Motor Sales had a respectable month with 169,000 deliveries and an 8.8% climb, but fell behind some of its main
competitors. The Toyota brand sold over 141,000 units and 29% of that came solely from the new Corolla sedan, up 12.8%, and
the Rav4 utility vehicle, up 60.8%, to offset slowing sales from the Camry sedan and the Prius lineup, down 2.6% and 6.9%,
respectively. Lexus performed well with nearly 23,000 units delivered and a 14.5% lift behind strong gains from its new IS sedan
and its SUV lineup, up 68.7% and 21.4%, respectively. Scion remains a sore spot for the company as it sold just over 4,900 units
for a 16.1% loss and its only model to achieve gains was the FR-S sports car, up 11.4%.
It was a relatively disappointing month for American Honda Motor Co. as its roughly 114,500 sales represented a 7.1% gain,
which was only ahead of Mazda’s 6.0% rise among all Japanese brands. The Honda brand had just over 100,000 deliveries, but
that amounted to only a 5.7% bump over last year after the Accord underperformed, dropping 11.2%. On a positive note, the
Civic, up 32.1%, and CR-V, up 11.6%, were in high demand and accounted for 49.8% of the brand’s tally. Acura stood out,
punching over 14,000 units, with 17.5% growth and 62.5% of the sales total came from the MDX and RDX, up 48.7% and 25.3%,
respectively. The brand’s newest cars also contributed with the RLX sedan adding 829 sales on top of strong ILX sedan growth,
up31.1%.
Nissan North America’s 14.2% jump resulted from its over 91,000 sales, mainly due to the Nissan brand’s nearly 82,000 deliveries
and 15.4% climb. The Pathfinder, Rogue and Sentra, up 90.4%, 53.1% and 49.3%, respectively, all recorded impressive months
relative to last year, but perhaps the biggest surprise came from its Frontier pickup truck, up 71.8%. On the other hand, Infiniti
found itself trailing much of the industry with only 4.5% growth on the heels of just over 9,000 sales. Accounting for only 10% of
the company’s volume, however, Infiniti did not hold the company back too much as it strives to transform its product portfolio
and brand image.
Luxury makers enjoyed outstanding success as nearly every brand realized increased sales with the only exception being Volvo
who fell 7.0%. Jaguar Land Rover has been steadily improving, selling 5,801 units for a 51.5% increase and the British company is
now up 19% year-to-date. German luxury brands also had a successful month as Audi, BMW, Daimler and Porsche combined to
sell over 82,000 vehicles, growing by 11.6%. That figure could have been much higher though as BMW had a very disappointing
month with just over 33,000 deliveries and only 2.9% growth due to a 49.5% drop in X5 sales. Daimler came out as the big winner
after its Mercedes-Benz brand sold over 32,000 vehicles and grew by 25.2% thanks to its E-Class and S-Class, up 22.6% and 74.6%,
respectively.
Incentive spending rises to its highest point since June
After declining over the last three months, average incentives spending crept back up this month to $2,583, per Autodata. While
sales increased by 10.5%, the growth in incentives was larger as spending was up 11.9%, the highest year-over-year jump since
March 2009.
NADA Used Car Guide | 8400 Westpark Drive | McLean, VA 22102 | 800.544.6232 | www.nada.com/b2b
5
©2013 NADA Used Car Guide
Guidelines | November 2013
Used Car Guide Update (continued…)
General Motors spent above the industry average, with its Chevrolet brand leading the spending, up 21%, followed by Buick and
Cadillac at 18% and 14%, respectively. The Ford brand took spending a step further with 35% growth while Lincoln increased only
1.5%. On the opposite end of the spectrum, Chrysler Group LLC did a better job of holding back as Chrysler was up only 9% while
Dodge and Jeep were down 0.3% and 22%, respectively.
Japan’s Big Three automakers exhibited more restraint as only
Incentives
Average of Total
YoY Change
$2,800
Toyota Motor Sales spent more, with its Toyota brand up 13% and its
15%
industry. Similarly, Nissan experienced a 1.4% pullback while Infiniti
was second to only Acura, with spending down 25%.
10%
$2,600
5%
$2,500
$2,400
0%
Percent Change
even more with incentives down 36%, the biggest drop in the
Average Incentive Spending
$2,700
Lexus brand up 28%. Honda’s spending fell 13% and Acura cut back
$2,300
-5%
$2,200
Continuing to befuddle its competitors was Subaru as it spent 14%
$2,100
less with average incentives of $771, the second lowest in the
-10%
Month
industry after only luxury brand Porsche at $717 per unit. The next
Source: Autodata
lowest spender among volume automakers was Honda with a 96% higher average of $1,514. Converse to Subaru’s situation was
Volkswagen, as its spending increased by 14% despite sales plummeting by 18%.
For the first time since December 2011, both finance and lease subvention usage went up, with increases of 9.8% and 5.4%,
respectively. Customer cash continues to increase as the 19.8% jump was the highest year-over-year rise since January 2009.
Incentives spending climbed at an alarming rate in October, with the only type of incentive to drop being dealer incentives, down
10.4%. With the increased growth in total incentives, it appears that automakers are pushing to maintain sales momentum, but
this could be an issue down the road. Customer cash remains a detriment to used vehicle retention, but with the year-over-year
jump being so high, it is apparent that automakers are ignoring the potential negative impact on used values.
Overall new vehicle supply increases by three days versus prior year
Inventory saw a significant rise in October, growing by 14 days to 76
New Vehicle Days' Supply
Days' Supply
days versus the prior month, while increasing by three days
YoY Change
90
18
80
compared to last year. GMC was the only brand in the industry to see
and Acura, as their days’ supply exhibited only slight increases of two
and four days, respectively. Meanwhile, Chrysler Group’s inventory
Days of Supply
finish at 85 days. Among the more notable luxury brands were BMW
60
8
50
40
3
30
20
-2
10
0
-7
climbed by 24 days despite sales outpacing the overall market.
Month
Source: Wardsauto.com
NADA Used Car Guide | 8400 Westpark Drive | McLean, VA 22102 | 800.544.6232 | www.nada.com/b2b
6
©2013 NADA Used Car Guide
Day Change
its inventory decrease from last month, going down by five days to
13
70
Guidelines | November 2013
Used Car Guide Update (continued…)
Clock strikes midnight: Volkswagen’s fairy tale ride turns into a pumpkin
By 2005, Volkswagen’s market share in the United States had fallen to a barely noticeable 1.3% and the company’s outlook was
less than stellar. Sales remained relatively flat in the years that followed, but in 2007, Volkswagen of America moved into its new
U.S. headquarters in Herndon, Va. and the company reinvested in its American operations. Despite falling sales through the
recession, market share continued to grow and by 2012, VW’s share had reached 3.0% and the brand notched 438,133 deliveries,
its highest mark since 1973. Volkswagen, the third-largest automaker in the world, became a Cinderella story in America and it
looked like the company’s dream of achieving 800,000 U.S. sales would easily become a reality.
The company had reason to be confident and optimistic, particularly with its new Jetta, Beetle and Passat models making
significant sales improvements in recent years. Heading into 2013, VW announced that it expected moderate sales growth of
roughly 11%, but things have taken a turn for the worse this year. After only six months of the year had passed, with sales having
fallen 1.0%, the brand reduced its sales target from 486,000 units to 440,000.
Per an Automotive News article published in July, incentive plans tied to the company’s aggressive sales objectives pressured
dealers to employ sales tactics that resulted in strained relationships with both the dealer network and consumers. At the start of
2013, VW implemented alterations to its stair-step performance bonus program, but the changes had the undesired effect of
causing friction between the organization and the dealers at the expense of consumers whose dealership experience was
worsened. By July, the automaker decided to unravel some of its revisions, but by then the damage had been recorded in the
winter release of NADA’s bi-annual dealer satisfaction survey as a record 75% of VW dealers responded and placed the
automaker below the rest of the industry with regards to dealer policies.
Incredibly, Volkswagen of America is on a dismal streak of seven straight months with year-over-year sales decreases and it is not
due to a shortage of vehicles. VW’s October month-end days’ supply of 115 days was the third-highest of all mainstream brands,
bettering only struggling Fiat and Mitsubishi. Through October 2013, the German brand’s average incentives spending increased
by 21%, behind only Hyundai, yet the Korean automaker’s spending is 44% less in comparison and is the third-lowest among all
volume brands. Currently, VW is the sixth-highest spender with regards to average incentives after being only the ninth-highest
at this time a year ago.
This month, the automaker sold 18% fewer units than last year, finishing with 28,129 deliveries. The year-over-year percent sales
decline was the worst in the entire industry and occurred despite the market growing by 10.5%. For the year, the brand is down
4.0% while the overall auto sales grew 8.3% and the only model in VW’s product portfolio with positive growth is the Beetle. Nine
out of 10 models in the lineup are down from last year and combined for an 8.4% drop. With the end of the year in sight, the
current state of the automaker’s U.S. operations leaves little reason to be optimistic in the New Year. Of course, America loves a
nice comeback story and things can certainly turn around for Volkswagen in 2014, but unlike in Cinderella’s fairy tale ending,
Prince Charming has yet to appear on the horizon.
NADA Used Car Guide | 8400 Westpark Drive | McLean, VA 22102 | 800.544.6232 | www.nada.com/b2b
7
©2013 NADA Used Car Guide
Guidelines | November 2013
Economic Update
As anticipated, the temporary federal government shutdown and the uncertainty over the debt limit were minor drags in growth
in October, and will take a small bite out of growth in the fourth quarter of 2013. Many economists estimate the shutdown,
which began on October 1 and lasted until October 17, will reduce growth by between one quarter and one half of a percentage
point in the final three months of the year. What’s more, reduced government spending continues to weigh on the economy
overall, as across-the-board spending cuts imposed by Congress earlier this year begin to bite. In the third quarter, federal
spending fell by 1.7%, slightly faster than the decline in the second quarter.
As expected, the Federal Open Market Committee (FOMC) announced no change to monetary policy. The central bank will
continue to purchase $85 billion per month of long-term Treasuries and mortgage-backed securities to put downward pressure
on interest rates. The FOMC also left in place the conditions for an increase in the federal funds rate.
The Labor Department reported that the unemployment rate rose to
Unemployment and Labor Participation Rates
Seasonally Adjusted
7.3% in October - up slightly from September’s figure of 7.2% - likely
Participation Rate
11.0
Unemployment Rate
67.0
10.0
66.0
Unemployment Rate (%)
9.0
The report noted that the shutdown did not affect total jobs as
nonfarm payrolls grew by 204,000 during the month. The BLS also
reported that employers added 60,000 more jobs in the previous two
8.0
65.0
7.0
6.0
64.0
5.0
63.0
4.0
3.0
Labor Participation Rate (%)
because furloughed federal workers were counted as unemployed.
62.0
2.0
months than earlier estimated.
Jul-13
Oct-13
Jan-13
Apr-13
Jan-13
Apr-13
Jul-12
Oct-12
Jan-12
Apr-12
Jul-11
Oct-11
Jan-11
Apr-11
Jul-10
Oct-10
Jan-10
Apr-10
Jul-09
Oct-09
Jan-09
Apr-09
Jul-08
Apr-08
The figures show hiring picked up in the fall. Employers added an
Oct-08
61.0
Jan-08
1.0
Month
Source: U.S. Bureau of Labor Statistics
average of 202,000 jobs from August through October, up from
Prior-Month Change in Nonfarm Payrolls
Seasonally Adjusted
Oct-12
Oct-12
Jul-13
Jul-12
Jul-12
Month
Source: U.S. Bureau of Labor Statistics
include single-family homes, townhomes, condominiums and co-ops, Total Housing Starts, Privately Owned
September. This is down from a revised 5.39 million in August, but is
10.7% above the 4.78 million-unit pace in September 2012. Sales
have remained above year-ago levels for the past 27 months.
Seasonally Adjusted
1300.0
1100.0
Housing Starts (thousands)
declined 1.9% to a seasonally adjusted annual rate of 5.29 million in
900.0
700.0
500.0
300.0
Jul-13
Jan-13
Apr-13
Jan-11
Oct-10
Jul-10
Apr-10
Jan-10
Oct-09
Jul-09
Jan-09
Apr-09
Jul-08
Oct-08
Jan-08
Apr-08
100.0
Month
Source: U.S. Census Bureau
NADA Used Car Guide | 8400 Westpark Drive | McLean, VA 22102 | 800.544.6232 | www.nada.com/b2b
8
©2013 NADA Used Car Guide
Oct-13
Jan-12
Apr-12
Oct-11
Oct-11
Jan-12
Jul-11
Apr-12
Apr-11
Jul-11
Jan-11
Oct-10
Jul-10
Apr-10
Jan-10
Oct-09
Apr-11
Total existing-home sales, which are completed transactions that
Jul-09
Jan-08
to the National Association of Realtors.
Apr-09
continued to pressure home prices in much of the country, according
Jan-09
sales declined in September, but limited inventory conditions
Jul-08
After hitting the highest level in nearly four years, existing-home
600.0
500.0
400.0
300.0
200.0
100.0
0.0
-100.0
-200.0
-300.0
-400.0
-500.0
-600.0
-700.0
-800.0
-900.0
Oct-08
year low. But that figure was likely distorted by the shutdown, too.
Prior-Month Change (thousands)
the percentage of Americans working or looking for work fell to a 35-
Apr-08
146,000 from May through July. One troubling detail in the report is
Guidelines | November 2013
Economic Update (continued...)
The national median existing-home price for all housing types was $199,200 in September, up 11.7% from September 2012. This
is the 10th consecutive month of double-digit year-over-year increases.
Total housing inventory at the end of September was unchanged at
S&P/Case-Shiller 20-City Composite Home Price Index
Three-month moving average published with a two-month lag.
2.21 million existing homes available for sale, which represents a 5.0-
190.0
180.0
month supply at the current sales pace, compared with a 4.9-month
there was a 5.4-month supply.
170.0
160.0
Index Level
supply in August. Unsold inventory is 1.8% above a year ago, when
150.0
140.0
130.0
The consumer price index increased 0.2% from August to September,
120.0
110.0
Jul-13
Jan-13
Apr-13
Jul-12
Oct-12
Jan-12
Apr-12
Jul-11
Oct-11
Jan-11
Apr-11
Jul-10
Oct-10
Jan-10
Apr-10
Jul-09
Oct-09
Jan-09
Apr-09
Jul-08
Oct-08
Jan-08
volatile food and energy prices, was up a scant 0.1% in September,
100.0
Apr-08
after increasing 0.1% the previous month. The core index, excluding
Month
Source: S&P Dow Jones
the same pace of growth as in August. Energy prices were up 0.8% in
September due to concern over possible U.S. intervention in Syria and turmoil in the Middle East, while food prices remained flat.
Retail sales rose a disappointing 0.2% in August, after a 0.4% gain in July. This was the weakest growth in sales since April. Strong
auto sales were the primary driver; excluding autos, retail sales were up a meager 0.1% in August. Consumer spending is growing
modestly. Wage growth is weak, and higher taxes this year and income cuts for federal government workers from the sequester
have weighed on after-tax income growth. Consumer spending growth will be stronger in 2014 as the drag from fiscal policy lifts
and the job market continues to improve.
Manufacturing has picked up from the middle of 2013 despite the government shutdown, as domestic demand continues its
steady improvement and global growth has started to pick up. Demand indicators point to further near-term gains in
manufacturing, although hiring growth will remain slow but steady. After leading the recovery over the past few years,
manufacturing will increase at roughly the same pace as the overall economy in 2014. Slow but steady growth in consumer
spending, a pickup in overseas demand and further recovery in the housing market will support manufacturing next year.
Gross U.S. refinery inputs in October averaged 15.4 million bbl/d, 800,000 bbl/d below the average for June through September.
Even with the recent decline in refinery runs, gross inputs remain above the five-year range for this time of year and gasoline
prices have continued to move downward. Strong global demand for diesel fuel and other distillates is resulting in high prices for
these products, keeping overall refinery margins attractive and refinery runs robust compared with seasonal norms, despite
anemic gasoline margins.
The U.S. average retail price of regular gasoline decreased 3 cents to $3.27 per gallon as of November 4, 2013, a new low for the
year, and 23 cents lower than last year at this time. Prices fell in all regions of the nation for the second consecutive week, with
the largest decrease coming in the Rocky Mountains, where the price dropped 6 cents to $3.31 per gallon. The national average
diesel fuel price fell one cent to $3.86 per gallon, 15 cents lower than last year at this time, and the lowest price since July 8,
2013.
NADA Used Car Guide | 8400 Westpark Drive | McLean, VA 22102 | 800.544.6232 | www.nada.com/b2b
9
©2013 NADA Used Car Guide
Guidelines | November 2013
Economic Update (continued...)
The U.S. economy grew at an annual rate of 2.8% in the third
Real Gross Domestic Product
in well above consensus estimates, which had been around 2.0%,
which also is acceleration from the second-quarter GDP growth rate
of 2.5%. The latest reading of economic growth shows the economy
strengthened in the months leading up to the government shutdown
and debt ceiling standoff. As gridlock in Washington likely shaved
several tenths of a percentage point off of economic growth in the
fourth quarter, this stronger-than-expected GDP growth figure may
Percent change from preceding period (%, SAAR)
Percent Change from Preceding Period
quarter, according to the Commerce Department. The figure comes
6.0
5.0
4.0
3.0
2.0
1.0
0.0
-1.0
-2.0
-3.0
-4.0
-5.0
-6.0
-7.0
-8.0
-9.0
Source: U.S. Bureau of Economic Analysis
Quarter
mean the economy will prove more resilient than expected in
responding to those negative shocks.
NADA Used Car Guide | 8400 Westpark Drive | McLean, VA 22102 | 800.544.6232 | www.nada.com/b2b
10
©2013 NADA Used Car Guide
Guidelines | November 2013
Fuel Price Data
Regular Grade Gasoline Prices (all formulations)
$ YoY Change
$0.40
$3.90
$0.30
$3.80
$0.20
$3.70
$0.10
$3.60
$0.00
$3.50
($0.10)
$3.40
($0.20)
$3.30
($0.30)
$3.20
($0.40)
$3.10
($0.50)
Price Change
Average Price
Average Price Per Gallon
$4.00
Month
Source: EIA
On-Highway Diesel Fuel Prices
Average Price Per Gallon
$4.15
$ YoY Change
$0.40
$4.10
$0.30
$4.05
$0.20
$3.95
$0.10
$3.90
$0.00
$3.85
Price Change
Average Price
$4.00
($0.10)
$3.80
($0.20)
$3.75
$3.70
($0.30)
Month
Source: EIA
U.S Regular Gasoline Prices (dollars per gallon, all formulations)
US
East Coast
Midwest
Gulf Coast
Rocky Mountain
West Coast
Oct-13
$3.34
$3.35
$3.27
$3.11
$3.44
$3.67
Sep-13
$3.53
$3.52
$3.50
$3.30
$3.60
$3.82
Oct-12
$3.75
$3.74
$3.62
$3.48
$3.72
$4.23
U.S On-Highway Diesel Fuel Prices (dollars per gallon)
Change From
Month Ago
Year Ago
Oct-13
Sep-13
($0.19)
($0.41) US
$3.89
$3.96
($0.17)
($0.39)
East Coast
$3.90
$3.97
($0.23)
($0.35)
Midwest
$3.86
$3.94
($0.19)
($0.37)
Gulf Coast
$3.80
$3.88
($0.16)
($0.28)
Rocky Mountain
$3.89
$3.94
($0.15)
($0.56)
West Coast
$4.05
$4.12
Oct-12
$4.09
$4.09
$4.06
$3.99
$4.22
$4.29
Change From
Month Ago
Year Ago
($0.07)
($0.20)
($0.07)
($0.19)
($0.08)
($0.20)
($0.08)
($0.19)
($0.05)
($0.33)
($0.07)
($0.24)
Source: EIA
NADA Used Car Guide | 8400 Westpark Drive | McLean, VA 22102 | 800.544.6232 | www.nada.com/b2b
11
©2013 NADA Used Car Guide
Guidelines | November 2013
NADAguides.com Consumer Site Trends — New Activity
About NADAguides.com
NADAguides.com is the most comprehensive vehicle information website on the internet today, offering a broad range of information and services to
help educate consumers in the market to buy, sell, trade, or simply shop for a vehicle.
NADAguides is an alliance partner of NADA Services Corporation.
The figures contained below are based on consumer activity at www.nadaguides.com and are calculated by measuring the number of unique lookups for
a given period of time.
New: Top 15 Researched Models — October 2013
YoY Change in Consumer Activity: NEW Make
Mercedes-Benz
2013 Rank
32%
Subaru
1
2
3
4
5
6
7
8
9
10
11
12
13
14
15
20%
Audi
14%
Acura
14%
Volkswagen
13%
Chrysler
11%
Lincoln
10%
Infiniti
9%
Honda
7%
Volvo
6%
Dodge
6%
Cadillac
5%
Ford
5%
MINI
5%
Mazda
3%
Porsche
2%
Toyota
1%
Lexus
BMW
-4%
2012 Rank
Nissan
-4%
1
2
3
4
5
6
7
8
9
10
11
12
13
14
15
-6%
Kia
-7%
Jeep
-13%
GMC
-13%
Scion
-15%
Chevrolet
-17%
Buick
-18%
Jaguar
-22%
Land Rover
-26%
Mitsubishi
Hyundai
-29%
-32%
-40%
-30%
Source: NADAguides.com
-20%
-10%
0%
MAKE
Ford
Chevrolet
Ram Truck
Honda
Toyota
Nissan
BMW
Volkswagen
Honda
Jeep
Toyota
Chevrolet
Ford
Ford
Jeep
MODEL
F-150
Silverado 1500
1500
Accord Sdn
Tacoma
Altima
3 Series
Jetta Sedan
CR-V
Wrangler
Camry
Silverado 1500
Mustang
Escape
Grand Cherokee
New: Top 15 Researched Models — October 2012
-1%
Smart
MY
2013
2013
2013
2013
2013
2013
2013
2013
2013
2013
2013
2014
2013
2013
2013
10%
20%
30%
40%
Percent Change
MY
2012
2012
2012
2013
2012
2012
2012
2012
2012
2012
2013
2012
2012
2012
2012
MAKE
Chevrolet
Ford
Chevrolet
Ford
Toyota
Ford
Ram Truck
Nissan
Chevrolet
Honda
BMW
Chevrolet
Chevrolet
Toyota
Honda
MODEL
Silverado 2500HD
F-150
Silverado 1500
F-150
Camry
Focus
1500
Altima
Impala
Accord Sdn
3 Series
Captiva Sport Fleet
Cruze
Tacoma
CR-V
NADA Used Car Guide | 8400 Westpark Drive | McLean, VA 22102 | 800.544.6232 | www.nada.com/b2b
12
©2013 NADA Used Car Guide
Guidelines | November 2013
NADAguides.com Consumer Site Trends — Used Activity
YoY Change in Consumer Activity: USED Make
Porsche
Suzuki
Saab
Mercedes-Benz
Lincoln
MINI
Infiniti
Audi
Mazda
Kia
Volvo
Nissan
Mercury
Buick
Volkswagen
GMC
Cadillac
Saturn
Mitsubishi
Jeep
Lexus
Chrysler
BMW
Acura
Subaru
Ford
Honda
Chevrolet
Toyota
Pontiac
Dodge
Scion
Hummer
Jaguar
Hyundai
Land Rover
27%
17%
17%
14%
13%
13%
13%
12%
12%
11%
10%
9%
9%
9%
8%
8%
7%
7%
6%
6%
6%
6%
6%
5%
5%
2%
0%
-1%
-1%
-1%
-2%
-8%
-10%
-12%
-13%
-14%
-20%
-15%
-10%
Source: NADAguides.com
Used: Top 15 Researched Models — October 2013
2013 Rank
1
2
3
4
5
6
7
8
9
10
11
12
13
14
15
MAKE
Ford
Chevrolet
Dodge
Honda
Toyota
Ford
Jeep
BMW
Ford
Chevrolet
Nissan
Chevrolet
Jeep
Chevrolet
Ford
-5%
0%
5%
10%
15%
20%
25%
30%
Percent Change
Used: Top 15 Researched Models — October 2012
2012 Rank
MODEL
F-150
Silverado 1500
Ram 1500
Accord Sdn
Camry
Mustang
Grand Cherokee
3 Series
Super Duty F-250
Impala
ALTIMA
Silverado 2500HD
Wrangler
Tahoe
Explorer
1
2
3
4
5
6
7
8
9
10
11
12
13
14
15
MAKE
Ford
Chevrolet
Dodge
Honda
Toyota
Ford
Nissan
Chevrolet
BMW
Jeep
Chevrolet
Ford
Ford
Chevrolet
Jeep
MODEL
F-150
Silverado 1500
Ram 1500
Accord Sdn
Camry
Mustang
Altima
Impala
3 Series
Grand Cherokee
Tahoe
Explorer
Super Duty F-250
Silverado 2500HD
Wrangler
NADA Used Car Guide | 8400 Westpark Drive | McLean, VA 22102 | 800.544.6232 | www.nada.com/b2b
13
©2013 NADA Used Car Guide
Guidelines | November 2013
NADA Official Used Car Guide® Value Trends
Monthly Change in NADA Used Car Guide Value
October 2013 v. November 2013
NADA Segment
2008MY
2009MY
2010MY
2011MY
2012MY*
Compact Car
-2.7%
-2.6%
-2.7%
-2.7%
-2.7%
Compact Utility
-2.0%
-1.8%
-1.3%
-1.4%
-1.5%
Large Pickup
-0.7%
-0.5%
-0.2%
-0.2%
-0.2%
Large SUV
-2.7%
-2.3%
-0.8%
-0.5%
-0.7%
Luxury Car
-2.1%
-2.1%
-1.8%
-1.9%
-0.8%
Luxury Utility
-2.0%
-2.0%
-1.4%
-1.8%
-1.1%
Mid-Size Car
-2.9%
-2.4%
-2.3%
-2.1%
-2.4%
Mid-Size Utility
-1.9%
-1.7%
-1.3%
-1.7%
-1.4%
Mid-Size Van
-3.0%
-1.4%
-1.7%
-1.2%
-0.7%
*Value movement can be influenced by newly valued vehicles. See the last page of "Guidelines" for data key.
Annual Change in NADA Used Car Guide Value
November, 2012 v. 2013
YoY Segment
NADA Segment
5YR
4YR
3YR
2YR
1YR
Change
Compact Car
2.7%
1.7%
5.9%
1.1%
3.6%
4.6%
Compact Utility
3.4%
3.0%
4.4%
3.2%
2.5%
1.2%
Large Pickup
9.6%
10.6%
5.4%
11.0%
5.4%
10.3%
Large SUV
9.4%
2.8%
1.2%
4.2%
3.5%
2.6%
Luxury Car
5.3%
2.7%
5.5%
1.9%
9.4%
3.1%
Luxury Utility
3.5%
8.7%
6.2%
-2.2%
0.3%
0.7%
Mid-Size Car
3.2%
1.0%
11.3%
2.2%
4.3%
5.6%
Mid-Size Utility
6.5%
4.6%
3.5%
1.7%
0.7%
2.9%
Mid-Size Van
19.3%
7.6%
3.7%
13.1%
5.0%
13.7%
*Calculations are based on vehicle age, i.e. values for 1 year old vehicles in CY2012 are compared against values for 1 year old vehicles in CY2011.
YTD Change in NADA Used Car Guide Value
January — November 2013
YTD Segment
2008MY
2009MY
2010MY
2011MY
2012MY
Change
Compact Car
-13.4%
-13.2%
-11.8%
-11.2%
-11.7%
-12.0%
Compact Utility
-13.1%
-11.6%
-9.7%
-8.2%
-7.7%
-9.5%
NADA Segment
Large Pickup
-4.4%
-3.7%
-2.6%
-0.8%
-1.5%
-2.5%
Large SUV
-10.7%
-10.0%
-7.9%
-5.5%
-5.7%
-7.7%
Luxury Car
-13.6%
-12.4%
-12.2%
-11.9%
-5.6%
-9.9%
Luxury Utility
-14.9%
-12.1%
-11.7%
-10.7%
-9.7%
-11.3%
Mid-Size Car
-11.9%
-10.8%
-10.5%
-9.8%
-9.6%
-10.2%
Mid-Size Utility
-13.7%
-12.3%
-10.0%
-9.0%
-8.7%
-10.4%
Mid-Size Van
-14.5%
-11.3%
-9.0%
-8.0%
-6.5%
-9.1%
NADA Used Car Guide | 8400 Westpark Drive | McLean, VA 22102 | 800.544.6232 | www.nada.com/b2b
14
©2013 NADA Used Car Guide
Guidelines | November 2013
At NADA Used Car Guide
CONTACTS:
What’s New
It’s here! Android device users can now download and subscribe to NADA MarketValues. NADA
MarketValues is our new mobile app designed exclusively for dealers. Subscriptions start at $50 per
month and are available for NADA Used Car Guide values and/or AuctionNet®, the industry’s top source
for wholesale transaction data. NADA values include weekly NADA auction values, as well as monthly
trade-in, loan and retail for used passenger cars and light-duty trucks. Download NADA MarketValues
from Google Play or the Apple Store for $1.99 and get your FREE 30 day trial started today! Contact us
at 800-544-6232 to learn more.
On the Road
The 2013 Used Car Week event runs November 11-15 in San Diego and Jonathan Banks, Larry Dixon,
Steve Stafford and John Beckman will be actively involved with the CPO Forum, the SubPrime Forum and
the National Remarketing Conference (NRC). Starting with the CPO Forum on November 12, join Larry
Dixon on the “CPO + Pre-Owned Pricing Trends, Analysis and Market Intelligence” panel at 2:30 p.m. At
the same time, Jonathan Banks will be presenting a SubPrime Forum workshop on “Used Vehicle Price
Trends and Understanding Difference When Considering Vehicle Age.” At the NRC Conference, you can
interact with Jonathan Banks at the “Used Car Prices and Valuations” panel discussion on November 13
at 2 p.m. and then join Jonathan and Larry at 3 p.m. for their workshop session on “Contemporary Risks
to Future Used Vehicle Prices.” Learn more about future Large Pickup prices, interest rates impact and
the risk outlook from the resurgence of leasing. And be sure to join us for our sponsorship of the NRC
Networking Breaks on November 13.
About NADA Used Car Guide
Celebrating our 80th year, NADA Used Car Guide has earned its reputation as the leading provider of
vehicle valuation products, services and information to businesses throughout the U.S. and worldwide.
NADA’s editorial team collects and analyzes over one million combined wholesale and retail automotiverelated transaction prices per month. Its guidebooks, auction data, analysis, and data solutions offer
automotive, financial, insurance, and government professionals the timely information and reliable
solutions they need to make better business decisions. Visit www.nada.com/b2b to learn more.
Financial Industry/
Accounting/
Legal/OEM Captive
Steve Stafford
800.248.6232 x7275
sstafford@nada.org
Credit Unions,
Fleet/Lease/
Rental Industry,
Government
Doug Ott
800.248.6232 x4710
dott@nada.org
Automotive
Dealers/Auctions,
Insurance
Jim Dodd
800.248.6232 x7115
jdodd@nada.org
Automotive
OEMs
Stu Zalud
800.248.6232 x4636
szalud@nada.org
Business
Development
Manager
Jim Gibson
800.248.6232 x7136
jgibson@nada.org
Director—Sales
and
Customer Service
Dan Ruddy
800.248.6232 x4707
druddy@nada.org
About AuctionNet®
AuctionNet® is an industry-unique wholesale transaction database, available exclusively from NADA Used Car
Guide, in joint partnership with the National Auto Auction Association (NAAA). Over 100 million records
strong and updated weekly, it captures sales from all Manheim and ADESA, as well as participating ABC,
ServNet and large independent auctions, representing over 80% of nationwide auction activity.
Manager—Public
Relations
Allyson Toolan
800.248.6232 x7165
571.292.7593 (mobile)
atoolan@nada.org
Disclaimer: NADA Used Car Guide makes no representations about future performance or results based on the data and the contents available in this report ("Guidelines"). Guidelines is provided for informational purposes only and is provided AS IS without
warranty or guarantee of any kind. By accessing Guidelines via email or the NADA website, you agree not to reprint, reproduce, or
distribute Guidelines without the express written permission of NADA Used Car Guide.
NADA Used Car Guide | 8400 Westpark Drive | McLean, VA 22102 | 800.544.6232 | www.nada.com/b2b
©2013 NADA Used Car Guide
© Copyright 2025
